SDG Target #17.19

SDG #17 is to “Strengthen the means of implementation and revitalize the Global Partnership for Sustainable Development”

Within SDG #17 are 19 targets, of which we here focus on Target 17.19:

By 2030, build on existing initiatives to develop measurements of progress on sustainable development that complement gross domestic product, and support statistical capacity-building in developing countries

Target 17.19 has two indicators:

  • Indicator 17.19.1: Dollar value of all resources made available to strengthen statistical capacity in developing countries

  • Indicator 17.19.2: Proportion of countries that (a) have conducted at least one population and housing census in the last 10 years; and (b) have achieved 100 per cent birth registration and 80 per cent death registration

This target highlights the work of PARIS21. This organisation works to help developing countries increase their statistical capacity.

The developing countries which had the most dollars available for statistical capacity were in Africa. Vietnam, Serbia, and Nepal also each spent over $10 million to this end in 2020. Global spending on increasing statistical capacity in 2020 was $541 million.

As of 2017, only a dozen countries hadn’t completed a census in the past decade. The country with the smallest proportion of registered births was in the Horn of Africa. In Ethiopia and Somalia, the rate was less than 6%. The global rate of birth registrations was 72% of births as of 2018. Several African countries and Afghanistan registered deaths at a rate lower than 10%.

SDG Target #8a

SDG #8 is to “Promote sustained, inclusive and sustainable economic growth, full and productive employment and decent work for all.”

Within SDG #8 are 12 targets, of which we here focus on Target 8.a:

Increase Aid for Trade support for developing countries, in particular least developed countries, including through the Enhanced Integrated Framework for Trade-related Technical Assistance to Least Developed Countries

Target 8.a has one indicator:

  • Indicator 8.a.1: Aid for Trade commitments and disbursements  

Aid for Trade is an initiative of the World Trade Organization for high-income donor countries to help developing countries to trade to further their economic development.

An example of aid which might help towards this end is infrastructure, such as transport networks and utilities, which all enable economic activity.

For the high-income OECD countries which give development assistance, in reporting what they’ve given, we can also separate what they’ve given as intended for Aid for Trade. Based on this, the developing regions as a whole received $52.5 billion as Aid for Trade in 2021. This figure has gone up and down in the years since the adoption of the Goals in 2015, when it was $62 billion. For the least developed countries, 2021 Aid for Trade commitments were $18.8 billion. This has also varied year-on-year since 2015, when it was $19.8 billion. On sum, this trend has been missing Target 8.a’s aim to increase Aid for Trade support.

On the donor side, the largest 2021 commitments earmarked for Air for Trade came from Germany, giving $7.3 billion, and Japan, with $6.8 billion. 

SDG Target #8.10

SDG #8 is to “Promote sustained, inclusive and sustainable economic growth, full and productive employment and decent work for all.”

Within SDG #8 are 12 targets, of which we here focus on Target 8.10:

Strengthen the capacity of domestic financial institutions to encourage and expand access to banking, insurance and financial services for all

Target 8.10 has two indicators:

  • Indicator 8.10.1: (a) Number of commercial bank branches per 100,000 adults and (b) Number of automated teller machines (ATMs) per 100,000 adults

  • Indicator 8.10.2: Proportion of adults (15 years and older) with an account at a bank or other financial institution or with a mobile-money-service provider  

One aspect of social inclusion is financial inclusion. This has become much more accessible with the proliferation of digital payment platforms to give access.

Worldwide, the number of commercial bank branches per 100,000 adults was 11.2 as of 2021, about the same as 2015. For the same year, there were 39 ATMs per 100,000 people worldwide, a small increase from 36 in 2015.

The proportion of adults with a bank account or similar in 2021 was 76%, an increase since the Goals adoption of 62%.

SDG Target #8.9

SDG #8 is to “Promote sustained, inclusive and sustainable economic growth, full and productive employment and decent work for all.”

Within SDG #8 are 12 targets, of which we here focus on Target 8.9:

By 2030, devise and implement policies to promote sustainable tourism that creates jobs and promotes local culture and products

Target 8.9 has one indicator:

  • Indicator 8.9.1: Tourism direct GDP as a proportion of total GDP and in growth rate  

This target introduces us to the work of another of the UN agencies, UN Tourism.

Tourism direct GDP, as measured in this Target’s sole indicator is the value-added by all industries contributing to tourism.

The global share of tourism direct GDP as a proportion of gross world product is 2.54% as of 2021. This is lower than at the adoption of the SDGs in 2015, when it was 3.75%.

The world leaders among countries with data in the SDG period are Fiji with 12% in 2019. For those with more recent data up to 2021, the leaders were Greece and UAE with 6%.

SDG Target #8.8

SDG #8 is to “Promote sustained, inclusive and sustainable economic growth, full and productive employment and decent work for all.”

Within SDG #8 are 12 targets, of which we here focus on Target 8.8:

Protect labour rights and promote safe and secure working environments for all workers, including migrant workers, in particular women migrants, and those in precarious employment

Target 8.8 has two indicators:

  • Indicator 8.8.1: Fatal and non-fatal occupational injuries per 100,000 workers, by sex and migrant status

  • Indicator 8.8.2: Level of national compliance with labour rights (freedom of association and collective bargaining) based on International Labour Organization (ILO) textual sources and national legislation, by sex and migrant status

This target gets us a little closer to understanding what SDG #8 means by “decent work.” We can measure decent work, like we can with all topics covered in the SDG targets and indicators. We need work to be decent to achieve the other Goals relating to poverty reduction and to fulfil the equality aspirations of the SDGs. For all work to be safe and secure helps to further this aim.

In an earlier instalment in this series, we explored two treaties which put the Universal Declaration of Human Rights into effect. Article 22 of one of these, the ICCPR, enshrines freedom of association into international law by its parties: 

“Everyone shall have the right to freedom of association with others, including the right to form and join trade unions for the protection of his interests.”

Some of the International Labour Organization conventions which guide international labour law include:

Relevant human rights instruments adopted by the UN General Assembly include:

Also relevant are two protocols supplementing a UN convention against Transnational Organized Crime:

Many of the countries which may have been at highest risk of fatal occupational injuries don’t have data as of 2021. Though among those who do, the highest is Egypt, with 10 per 100,000 workers. For non-fatal occupational injuries, the highest is Costa Rica, with 9421 per 100,000 workers.

When measuring level of national compliance with labour rights, the world has scored 4.5 out of 0-10 measure, with 0 being the best. The worst performers as of 2021 were Iran and UAE with a score of 10, followed by China, scoring 9. 

SDG Target #8.7

SDG #8 is to “Promote sustained, inclusive and sustainable economic growth, full and productive employment and decent work for all.”

Within SDG #8 are 12 targets, of which we here focus on Target 8.6:

Take immediate and effective measures to eradicate forced labour, end modern slavery and human trafficking and secure the prohibition and elimination of the worst forms of child labour, including recruitment and use of child soldiers, and by 2025 end child labour in all its forms

Target 8.7 has one indicator:

  • Indicator 8.7.1: Proportion and number of children aged 5–17 years engaged in child labour, by sex and age

First, at the time of writing, we’re six months shy of 2025, and haven’t ended child labour in all its forms, so this aspect of this target is already foregone.

This target encapsulates the work of several UN labour and human rights agreements protecting the welfare of children:

As of 2020, UNICEF estimated 160 million children worldwide were in child labour, with an 8.4 million increase in the preceding four years.

The countries with the highest rates of child labour among those with data as of 2022 were Chad with 31% and Togo with 33%. Disaggregated by sex, in Togo, more boys were in child labour than girls by 3%, and in Chad, the gender difference was 6%. The biggest gender gap among countries with 2022 data was Senegal, with 8% of girls in labour and a quarter of boys.

SDG Target #8.6

SDG #8 is to “Promote sustained, inclusive and sustainable economic growth, full and productive employment and decent work for all.”

Within SDG #8 are 12 targets, of which we here focus on Target 8.6:

By 2020, substantially reduce the proportion of youth not in employment, education or training 

Target 8.6 has one indicator:

  • Indicator 8.6.1: Proportion of youth (aged 15–24 years) not in education, employment or training 

There aren’t yet any global figures for the proportion of youth not in education, employment, or training. Of those countries with data for this indicator, Niger and Afghanistan are the worst-performing, with 68% and 62%. Rather than the proportion reducing, in both countries it’s rise since 2014: in Niger from 25% and Afghanistan from 35%. The Netherlands is the leader with 2%, having reduced from 4.7% in 2014.

SDG Target #8.5

SDG #8 is to “Promote sustained, inclusive and sustainable economic growth, full and productive employment and decent work for all.”

Within SDG #8 are 12 targets, of which we here focus on Target 8.5:

By 2030, achieve full and productive employment and decent work for all women and men, including for young people and persons with disabilities, and equal pay for work of equal value

Target 8.5 has two indicators:

  • Indicator 8.5.1: Average hourly earnings of employees, by sex, age, occupation and persons with disabilities

  • Indicator 8.5.2: Unemployment rate, by sex, age and persons with disabilities  

Only a couple dozen countries have data for employees’ average hourly earnings. The highest among them was Switzerland. By sex, the greatest difference was in South Korea, where the average hourly earnings of male employees of $23.96 and $15.91 for women.

The global unemployment rate as of 2022 was 5.3%, with gender differences only a fractional difference.

SDG Target #8.4

SDG #8 is to “Promote sustained, inclusive and sustainable economic growth, full and productive employment and decent work for all.”

Within SDG #8 are 12 targets, of which we here focus on Target 8.4:

Improve progressively, through 2030, global resource efficiency in consumption and production and endeavour to decouple economic growth from environmental degradation, in accordance with the 10-Year Framework of Programmes on Sustainable Consumption and Production, with developed countries taking the lead 

Target 8.4 has two indicators:

  • Indicator 8.4.1: Material Footprint, material footprint per capita, and material footprint per GDP

  • Indicator 8.4.2: Domestic material consumption, domestic material consumption per capita, and domestic material consumption per GDP 

Material footprint is a measure of the tonnage of natural resources extracted from the Earth. This includes metal ores, fossil fuels, minerals or living matter from plants and animals. Many of these are finite and non-renewable resources.

By contrast, the concept of domestic material consumption is a measure of materials used within a country’s economy.

It’s important we understand that the economy, which is the basis upon which we all prosper, itself rests upon an environment foundation. This begs the question how is the environment to cope as we live on a planet with a spiking increase in resource use? What is the pathway out of this pattern, to unlink economic growth from scarce resource use and extraction?

The world’s material footprint per capita was 12.44t as of 2019, the same figure as 2015. Thus, there has been no improvement on this indicator, as the target has asked of us. Indicator 8.4.1 asked us to measure by GDP as well as per capita. The world’s material footprint in 2019 was 1.14kg per US dollar, with not much of a change since 2015.

The domestic material consumption per capita for the world was 12 tonnes as of 2019, about the same since 2015. The target asked for developed countries to take the lead. As a proxy, we can use Europe and Northern America. This region had 18t of domestic material consumption in 2019, which has also remained the same since the start of the SDGs.

The global domestic material consumption is equal to 1.13kg per dollar. Once more, this is little changed from 2015, with a similar trend for Europe and Northern America.

SDG Target #8.3

SDG #8 is to “Promote sustained, inclusive and sustainable economic growth, full and productive employment and decent work for all.”

Within SDG #8 are 12 targets, of which we here focus on Target 8.3:

Promote development-oriented policies that support productive activities, decent job creation, entrepreneurship, creativity and innovation, and encourage the formalization and growth of micro-, small- and medium-sized enterprises, including through access to financial services

Target 8.3 has one indicator:

  • Indicator 8.3.1: Proportion of informal employment in total employment, by sector and sex

Of the countries with data, many of the Least Developed Countries had greater than 80% of workers in non-agricultural informal work. The numbers are also high in the very populous countries India and Bangladesh, with 80% and 91% of workers in the informal sector. 

Much fewer countries have data for informal employment in the agriculture sector. This includes many of the countries with highest proportions of informality in non-agriculture. Developing countries with 2022 data had between 80-100% informal employment in agriculture.

The country with the greatest gender imbalance in the non-agricultural sector was Cote d'Ivoire. There, 79% of men were in informal employment and 93% of females. In agriculture, the biggest gender disparities among countries with data were in Europe. 31% of Serbian males compared to 68% of women were in informal employment, and 42% of males and 78% of women in Poland. 

SDG Target #8.2

SDG #8 is to “Promote sustained, inclusive and sustainable economic growth, full and productive employment and decent work for all.”

Within SDG #8 are 12 targets, of which we here focus on Target 8.1:

Sustain per capita economic growth in accordance with national circumstances and, in particular, at least 7 per cent gross domestic product growth per annum in the least developed countries

Target 8.1 has one indicator:

  • Indicator 8.1.1: Annual growth rate of real GDP per capita 

This target and indicator ask for us to aim for an increase of GDP, but also to keep pace with price rises from inflation, but also population growth. If GDP rises 7%, but so does the population growth, the actual rise in GDP cancels out. Likewise, if the GDP rises 7% but the inflation rate is 4%, then the GDP growth is only 3%.

The per capita annual growth rate for the world economy in 2022 was 2.28%, an increase from 1.86% in 2015, the year of the SDGs adoption. In the years following 2015, there was a dip in 2016 to 1.60%, followed by an increase in 2017, a tiny dip in 2018, a drop in 2019 to 1.51%, then a big drop in 2020 to -4.03%. 2021 saw a 5.31% rise, before an almost halving in 2022.

In 2022, the only Least Developed Countries with GDP growth rates above 7% was Niger with 7.43%

SDG Target #8.1

SDG #8 is to “Promote sustained, inclusive and sustainable economic growth, full and productive employment and decent work for all.”

Within SDG #8 are 12 targets, of which we here focus on Target 8.1:

Sustain per capita economic growth in accordance with national circumstances and, in particular, at least 7 per cent gross domestic product growth per annum in the least developed countries

Target 8.1 has one indicator:

  • Indicator 8.1.1: Annual growth rate of real GDP per capita 

This target and indicator ask for us to aim for an increase of GDP, but also to keep pace with price rises from inflation, but also population growth. If GDP rises 7%, but so does the population growth, the actual rise in GDP cancels out. Likewise, if the GDP rises 7% but the inflation rate is 4%, then the GDP growth is only 3%.

The per capita annual growth rate for the world economy in 2022 was 2.28%, an increase from 1.86% in 2015, the year of the SDGs adoption. In the years following 2015, there was a dip in 2016 to 1.60%, followed by an increase in 2017, a tiny dip in 2018, a drop in 2019 to 1.51%, then a big drop in 2020 to -4.03%. 2021 saw a 5.31% rise, before an almost halving in 2022.

In 2022, the only Least Developed Countries with GDP growth rates above 7% was Niger with 7.43%

SDG Target #7.b

SDG #7 is to “Ensure access to affordable, reliable, sustainable and modern energy for all.”

Within SDG #7 are 5 targets, of which we here focus on Target 7.b:

By 2030, expand infrastructure and upgrade technology for supplying modern and sustainable energy services for all in developing countries, in particular least developed countries, small island developing States and landlocked developing countries, in accordance with their respective programmes of support

Target 7.b has one indicator:

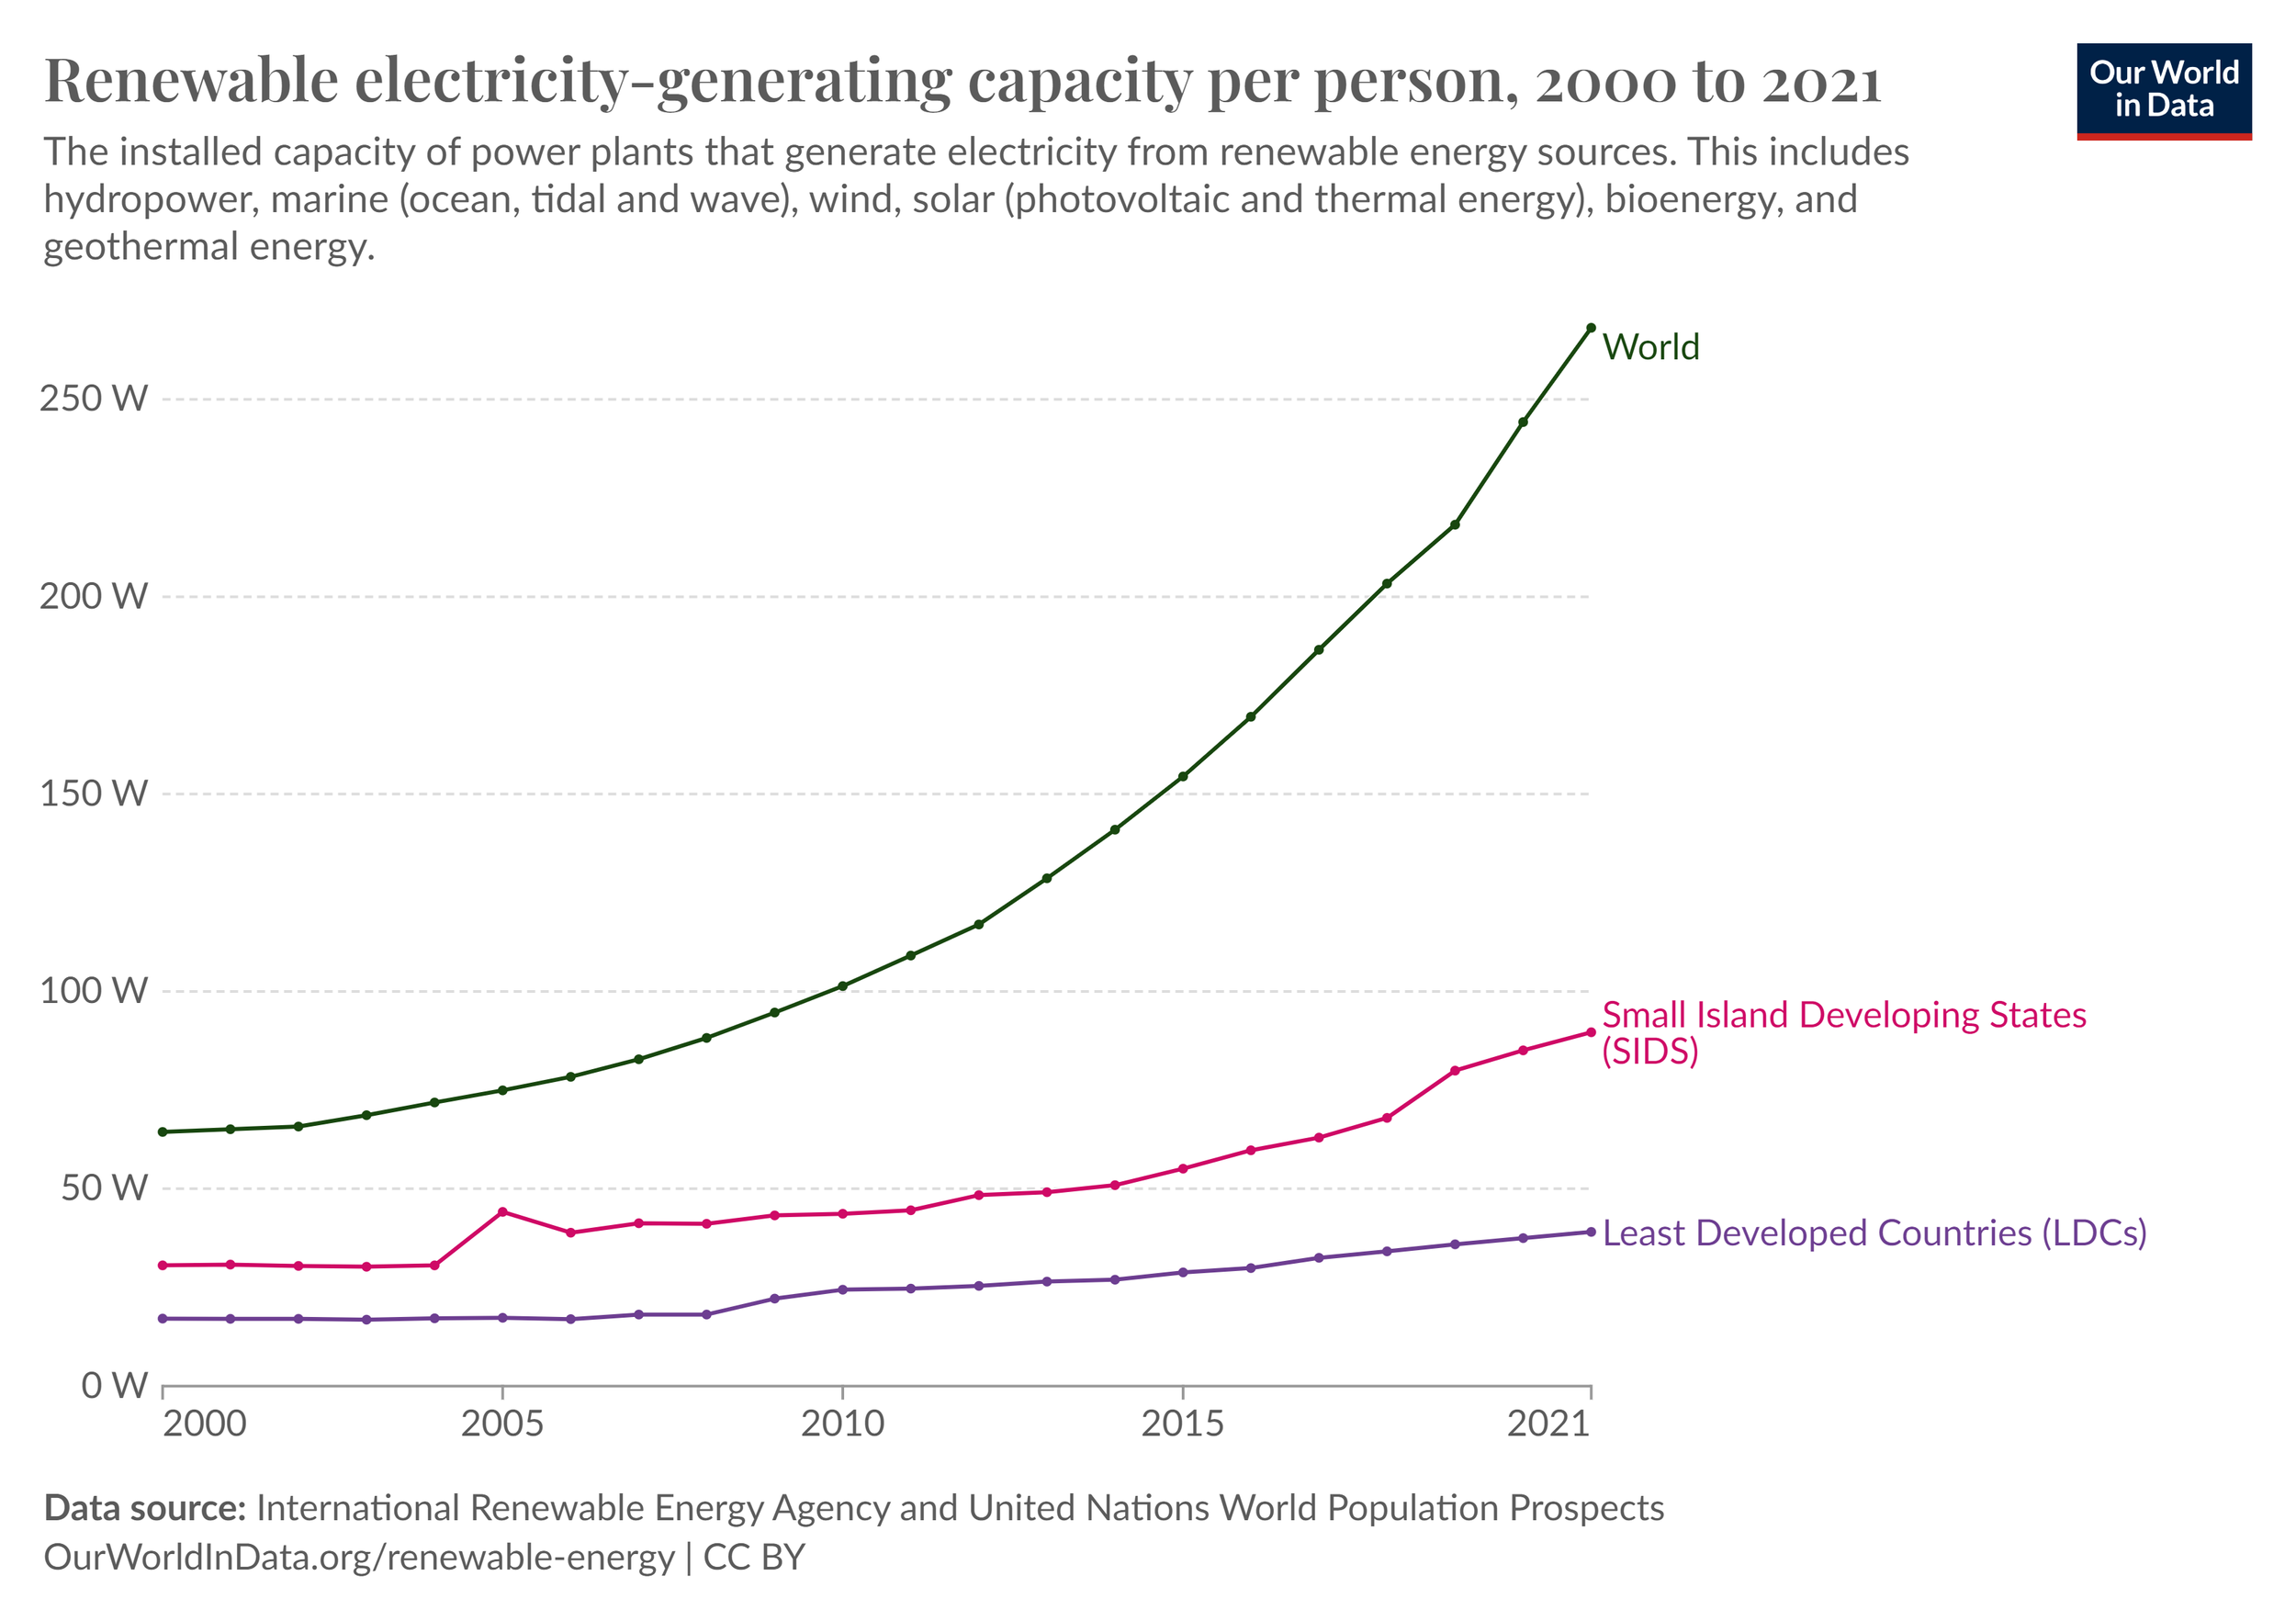
  • Indicator 7.b.1: Installed renewable energy-generating capacity in developing and developed countries (in watts per capita)

The least developed countries face the prospects of the largest growth in population in the years to come. The existing dearth of energy for these countries takes on a double importance for their eventual access to be renewable. What if it's not, and such energy access comes from fossil fuels? The fight against climate change would be all but lost to accommodate the increase in living standards. This isn’t fair, to deprive such developing countries from access, thus its vital access comes via renewable energy

Th global capacity of renewable energy as of 2021 was 268 watts per capita, an increase from 154 watts per capita in 2015. In the Least Developed Countries in 2021, it was 39 watts per capita, up from 28 watts in 2015. In the Small Island Developing States, renewable energy capacity was 89 watts per capita in 2021, up from 55 watts in 2015.

SDG Target #7.a

SDG #7 is to “Ensure access to affordable, reliable, sustainable and modern energy for all.”

Within SDG #7 are 5 targets, of which we here focus on Target 7.a:

By 2030, enhance international cooperation to facilitate access to clean energy research and technology, including renewable energy, energy efficiency and advanced and cleaner fossil-fuel technology, and promote investment in energy infrastructure and clean energy technology

Target 7.a has one indicator:

  • Indicator 7.a.1: International financial flows to developing countries in support of clean energy research and development and renewable energy production, including in hybrid systems

The International Renewable Energy Agency tracks financing of aid for renewable energy.

In 2021, OECD country donors gave $10 billion as foreign aid intended for clean energy. Not only is this amount down from the 2017 peak of $27 billion, it’s also a decrease from the 2015 amount of $12 billion. It’s thus not on track to “enhance international cooperation” in the form of aid for renewable energy, as this target asks of us. 

SDG Target #7.3

SDG #7 is to “Ensure access to affordable, reliable, sustainable and modern energy for all.”

Within SDG #7 are 5 targets, of which we here focus on Target 7.3:

By 2030, double the global rate of improvement in energy efficiency

Target 7.3 has one indicator:

  • Indicator 7.3.1: Energy intensity measured in terms of primary energy and GDP 

The global energy intensity in 2020 was $4.54 of economic value produced per megajoule of energy used. This was down a little from the figure at the adoption of the SDGs in 2015 of $4.83 per megajoule. But it's still far from the doubling of improvement required for this target, which would be a halving of the energy intensity. 

SDG Target #7.2

SDG #7 is to “Ensure access to affordable, reliable, sustainable and modern energy for all.”

Within SDG #7 are 5 targets, of which we here focus on Target 7.2:

By 2030, ensure universal access to affordable, reliable and modern energy services

Target 7.2 has one indicator:

  • Indicator 7.2.1: Renewable energy share in the total final energy consumption 

The renewable energy share in final energy consumption worldwide is 19% using 2020 data, far from this target’s aim of universal access to move away from the emission of carbon dioxide.

SDG Target #7.1

SDG #7 is to “Ensure access to affordable, reliable, sustainable and modern energy for all.”

Within SDG #6 are 5 targets, of which we here focus on Target 7.1:

By 2030, ensure universal access to affordable, reliable and modern energy services

Target 7.1 has two indicators:

  • Indicator 7.1.1: Proportion of population with access to electricity

  • Indicator 7.1.2: Proportion of population with primary reliance on clean fuels and technology 

The obvious importance of electricity access lies as it’s a marker of living standards, as well as a necessity for health.

The World Bank has measured access to electricity worldwide to be 91% as of 2021. To break this up, Europe and Central Asia have full electrification, as do the high-income and the upper-middle income countries. The regions of the Middle East and North Africa, Latin America and the Caribbean and East Asia and the Pacific have between 97-98%. The lower-middle income countries have a similar proportion to the global population. 45% in low-income countries have electricity. 

As we saw in Target 3.9, air pollution from stoves burning solid cooking fuels in households in some developing countries is a health risk. By contrast, in high-income countries, households tend to use cooking and energy methods not posing a health risk. Dirty fuels also pose affect the environment and contribute to climate change.

The World Health Organization estimates access to clean cooking fuels to be 71% of the world population.

SDG Target #6.b

SDG #6 is to “Ensure availability and sustainable management of water and sanitation for all”

Within SDG #6 are 8 targets, of which we here focus on Target 6.b:

Support and strengthen the participation of local communities in improving water and sanitation management 

Target 6.b has one indicator:

  • Indicator 6.b.1: Proportion of local administrative units with established and operational policies and procedures for participation of local communities in water and sanitation management

The data for this target draws from UN Water’s Global Analysis and Assessment of Sanitation and Drinking-Water (GLAAS). The World Health Organization puts this assessment into effect.

We’re here looking at water at the local government level. A handy tool is the OECD’s Water Governance Indicator Framework to assess policies. This framework is part of the OECD’s water program, which advises governments on water policies. The OECD also has 12 Principles on Water Governance it recommends for governments.

As of 2019, 70% of countries had in place policies and procedures for community participation in water and sanitation.

SDG Target #6.a

SDG #6 is to “Ensure availability and sustainable management of water and sanitation for all”

Within SDG #6 are 8 targets, of which we here focus on Target 6.a:

By 2030, expand international cooperation and capacity-building support to developing countries in water- and sanitation-related activities and programmes, including water harvesting, desalination, water efficiency, wastewater treatment, recycling and reuse technologies

Target 6.a has one indicator:

  • Indicator 6.a.1: Amount of water- and sanitation-related official development assistance that is part of a government-coordinated spending plan  

Using the OECD’s Creditor Reporting System, we can disaggregate development flows by type. In this instance, we want to separate out water aid. 

Let's look at ODA spent on water as part of a government’s budget. As of 2021, the biggest spender was India, with $420 million. Following was Vietnam and Cambodia, with $413 million and $309 million, then Bangladesh with $284 million and Egypt with $261 million.

SDG Target #6.5

SDG #6 is to “Ensure availability and sustainable management of water and sanitation for all”

Within SDG #6 are 8 targets, of which we here focus on Target 6.5:

By 2030, implement integrated water resources management at all levels, including through transboundary cooperation as appropriate

Target 6.5 has two indicators:

  • Indicator 6.5.1: Degree of integrated water resources management 

  • Indicator 6.5.2: Proportion of transboundary basin area with an operational arrangement for water cooperation 

What is integrated water resources management (IWRM)? In some ways, it’s reflective of the concept of sustainable development as it relates to water. It means to devise and put into effect a system which manages water resources with several considerations. It needs to consider the economic, social, and in particular the environmental aspects. At the governmental level, it can involve the coordination of several ministries. These might include the portfolios of water, planning, land, agriculture, and rural development.

Managing water resources is of utmost importance for the environment. But it also has large social, and economic implications in water scarce regions such as Western Asia and Africa. Every drop seems to count to ensure dignity and prosperity in these regions.

The Global Water Partnership, a network of over 3000 water organisations, and DHI, support such efforts. Managing water is relevant not only at the national level, but across countries within regions sharing a common border. It likewise has importance across administrative divisions within countries. 

This issue of water resources shared across borders brings us to Indicator 6.5.2. This is relevant whether a shared water body is visible on the surface, or groundwater in an aquifer. This topic seems ripe for conflict in water scare regions, and as such, competing interests need managing. International treaties between nations on the sustainable use of transboundary freshwater aid this. The most prominent example is the 1997 Water Convention.

The degree to which an integrated water resources management plan is in effect across all countries worldwide is 54% as of 2020. France and Singapore lead with 100% implementation. A half-dozen countries score 0, among them Argentina, Canada, and Venezuela.

41% of global aquifers have transboundary basins with arrangements to cooperate over water as of 2022. 65% of river and lake basins have such coverage, with 58% for both combined.