SDG Target #3.c

SDG #3 is to “To ensure healthy lives and promote well-being for all at all ages.”

Within SDG #3 are 13 targets, of which we here focus on Target 3.c:

Substantially increase health financing and the recruitment, development, training and retention of the health workforce in developing countries, especially in the least developed countries and small island developing states.

Target 3.c has one indicator:

  •  Indicator 3.c.1: Health worker density and distribution

According to 2017 data, reflecting only two years after the adoption of the Sustainable Development Goals in 2015, the number of medical doctors per 1,000 people in the world was 1.75. For the low-income countries, this number was 0.32 doctors for every thousand people, in contrast to 3.73 in high-income countries and 1.49 for middle-income countries.

SDG Target #3.b

SDG #3 is to “To ensure healthy lives and promote well-being for all at all ages.”

Within SDG #3 are 13 targets, of which we here focus on Target 3.b:

Support the research and development of vaccines and medicines for the communicable and non‑communicable diseases that primarily affect developing countries, provide access to affordable essential medicines and vaccines, in accordance with the Doha Declaration on the TRIPS Agreement and Public Health, which affirms the right of developing countries to use to the full the provisions in the Agreement on Trade-Related Aspects of Intellectual Property Rights regarding flexibilities to protect public health, and, in particular, provide access to medicines for all.

Target 3.b has three indicators:

  • Indicator 3.b.1: Proportion of the target population covered by all vaccines included in their national program.

  • Indicator 3.b.2: Total net official development assistance (ODA) to medical research and basic health sectors.

  • Indicator 3.b.3: Proportion of health facilities that have a core set of relevant essential medicines available and affordable on a sustainable basis.

First of all, what is the Doha Declaration, as mentioned in the body of the target. This refers to an agreement made in Doha, Qatar at the Fourth Ministerial Conference of the World Trade Organization in 2001. The World Trade Organization is the world’s peak international organisation for international trade, and though it works alongside the UN, is independent of it. 

The focus of the declaration  for this target is on the TRIPS Agreement, an international treaty which stands for Agreement on Trade-Related Aspects of Intellectual Property Rights. The TRIPS Agreement is an annex of the Marrakesh Agreement establishing the World Trade Organization, signed in the Moroccan city in 1994. One of the key relationships between the World Trade Organization and the UN in relation to the TRIPS Agreement is via the World Intellectual Property Organization, one of the UN specialised agencies

This Marrakesh Agreement was the result of the so-called Uruguay Round of multilateral trade negotiations, within the framework of another international treaty, the General Agreement on Tariffs and Trade (GATT) designed to reduce or remove international trade barriers, tariffs and import quotas. 

In turn, the lengthy Uruguay Round of international trade negotiations, drawn out over 1986 to 1994, resulted in the establishment of the World Trade Organization to replace the GATT, with the Marrakesh Agreement acting as one of the WTO’s founding documents.

To turn back to the TRIPS Agreement, this WTO treaty relates to the enforcement of intellectual property rights worldwide, both for authors of creative works, and all manner of copyrights, patents and trademarks. 

The nature of the Doha Declaration is to recognise the importance of public health of developing countries, and least developed countries in particular, who are at the frontline of infectious epidemics such as HIV/AIDS, malaria and tuberculosis. 

As it applies to the TRIPS Agreement, the Doha Declaration on the TRIPS Agreement and Public Health makes it clear public health ought to take precedence over intellectual property, and though intellectual property rights is an important aspect of drug discovery, it should be balanced with the prices with which such medicines are made available in the poorest countries.

Within the definitions of our first official indicator for this target regarding vaccine coverage, we’re looking at the vaccines recommended by WHO and UNICEF, including two doses of measles, a full schedule of HPV, three doses of pertussis, and the toxoid vaccines of tetanus and diphtheria, whereby the toxins from bacteria are weakened. Also included is an immunisation for pneumococcal disease.

Looking at progress for this indicator, as of 2021, 81% of the one-year-olds worldwide have been immunised with the DPT vaccine, a 4% decrease since 2015, at the adoption of the SDGs. 71% of children worldwide had been vaccinated for measles as of 2021, up from 63% in 2015. 51% of one-year-olds had been vaccinated for pneumococcal disease in 2021, up from 38% in 2015. Worldwide, 12% of adolescent girls had been vaccinated for HPV as of 2021, up from 9% in 2015.

For the second indicator relating to ODA given to medical research and health, we can measure this via OECD data. Within the OECD is the DAC, or Development Assistance Committee, consisting of the high-income donor countries. Using this data, reported via the OECD’s Creditor Reporting System, we can see, for each donor, what amounts each year have been given of their total official development assistance flows to which sectors. In this instance, we want to see how many millions of US dollars have been given to the basic health sector and medical research.

Now is also an opportunity to look at the regions within which the World Health Organization divides its operations among its Member States, as the data for the final indicator is disaggregated into these regions to show access to essential medicines. These World Health Organization regions are:

These essential medicines are defined by the World Health Organization into the WHO Model Lists of Essential Medicines, including the Essential Medicines for Children, selected by the World Health Organization’s Expert Committee on Selection and Use of Essential Medicines. The intention is for sufficient quantities of essential medicines to be available at health facilities for affordable prices, per the defined dosages. Such medicines can be out of reach of the daily wages of some living below national poverty lines, earning the lowest pay for unskilled work in the labour market.

SDG Target #3.a

SDG #3 is to “To ensure healthy lives and promote well-being for all at all ages.”

Within SDG #3 are 13 targets, of which we here focus on Target 3.a:

Strengthen the implementation of the World Health Organization Framework Convention on Tobacco Control in all countries, as appropriate

Target 3.a has one indicator:

  • Indicator 3.a.1: Age-standardized prevalence of current tobacco use among persons aged 15 years and older

The World Health Organisation FCTC, or Framework Convention on Tobacco Control, is an international treaty overseen by the World Health Organisation, adopted in 2005 at the 56th World Health Assembly, which exists alongside the Protocol to Eliminate Illicit Trade in Tobacco Products, a treaty aiming to eliminate the illicit trade of tobacco. Another program within the WHO working toward raising awareness of tobacco’s threats and ways to reduce it’s use is the Tobacco Free Initiative.

In the West, we’re most  familiar with tobacco in the form of cigarettes, but let’s take a look around the world to see how different cultures adapt the plant from the nightshade family  belonging to the genus Nicotiana. According to the definitions of this target and its indicator, tobacco includes such applications as Indonesian kretek, which is blended with cloves, and snus, popular in Sweden and Norway, which is a form of dipping tobacco, placed between the lip and the gum, similar to naswar in Afghanistan, or toombak in Sudan. Dipping tobacco poses a threat of cancer of the mouth and throat.

Smokeless forms of tobacco go by many names throughout India and South Asia. One of these is gutkha, a combination of tobacco and calcium hydroxide; catechu, which is an extract from the tree Senegalia catechu; nuts from the areca palm tree; and leaves of the betel tree. Though smokeless, these products still pose a medical threat and can cause cancer. This preparation can also be made without tobacco, whereby it’s known as paan, or betel nut chewing, though still poses a cancer risk without the inclusion of tobacco.

The indigenous Yup’ik people of Alaska and Russian Far East use a smokeless tobacco product known as iq’mik, which poses a risk of heart disease, stroke and metabolic disorders such as diabetes and liver disease.

The FCTC reports on global progress to lower the trends of the prevalence of tobacco use. This data shows the global share of tobacco use is 22% as of 2020, not much further down than rate of 24% at the time of the SDGs adoption in 2015.

SDG Target #3.9

SDG #3 is to “To ensure healthy lives and promote well-being for all at all ages.”

Within SDG #3 are 13 targets, of which we here focus on Target 3.9:

By 2030, substantially reduce the number of deaths and illnesses from hazardous chemicals and air, water and soil pollution and contamination

Target 3.9 has three indicators:

  • Indicator 3.9.1: Mortality rate attributed to the household (indoor) and ambient (outdoor) air pollution.

  • Indicator 3.9.2: Mortality rate attributed to unsafe water, sanitation, and lack of hygiene.

  • Indicator 3.9.3: Mortality rate attributed to unintentional poisoning.

Exposure to PM2.5, or particulate matter of a diameter of 2.5 micrometres or less, from both outdoors and household air pollution, poses great risks to health worldwide. Much of the culprit of household air pollution is due to the use of 2.4 billion people worldwide cooking using open fires or stoves burning biomass, kerosene or coal, resulting in an estimated 3 million annual deaths. The saddest facet of these deaths is such individuals simply wish to have access to energy, but the only form affordable and accessible to them compromise their air quality, and affect their health. 

The air in people’s home’s is killing millions, attributable to the burning of solid cooking fuels like wood, despite it being since the times of the earliest humans. Other fuels which put populations at risk in the home from burning are animal dung, charcoal, agricultural waste, and inefficient kerosene stoves.

Some of the causes of deaths which put populations at risk from long-term exposure to ambient fine particulate matter can be caused by conditions affecting the blood flow and blood vessels in the brain, and problems due to narrowed arteries in the heart, which supply blood to the heart’s muscles. Such risks of the burdens of disease from exposure are due to behaviours, environments and occupations..

To help measure this, the World Health Organization’s Global Health Estimates are used, which separate deaths by country and cause.

Mortality from inadequate water, sanitation and hygiene is most observed in low- and middle-income countries, which we’ll explore in greater detail when looking at SDG #6 (Clean Water & Sanitation).

As of 2019, the global death rate from household and ambient air pollution stands at 104 per 100,000 people; 18 deaths per 100,000 from unsafe water, sanitation and hygiene, and 1 death from unintentional poisoning per 100,000.

SDG Target #3.8

SDG #3 is to “To ensure healthy lives and promote well-being for all at all ages.”

Within SDG #3 are 13 targets, of which we here focus on Target 3.8:

Achieve universal health coverage, including financial risk protection, access to quality essential health-care services and access to safe, effective, quality and affordable essential medicines and vaccines for all

Target 3.8 has two indicators:

  • Indicator 3.8.1: Coverage of essential health services.

  • Indicator 3.8.2: Proportion of population with large household expenditures on health as a share of total household expenditure or income

Because of the inherent inequality of extreme poverty, of which 712 million people live below $2.15 a day as of 2022, those living in such destitution are often excluded from healthcare coverage. Instead, the international community needs to finance healthcare services of those countries unable to use their own resources, and protect the most vulnerable from what could be devastating costs.

According to the World Health Organisation, the measure of coverage for essential health services includes 14 indicators for:

  • Family planning

  • Pregnancy care

  • Child immunisation

  • Treatment of children

  • Tuberculosis

  • HIV/AIDS

  • Malaria

  • Water, sanitation and hygiene

  • Hypertension

  • Diabetes

  • Tobacco

  • Hospital access

  • Health workforce

  • Health security

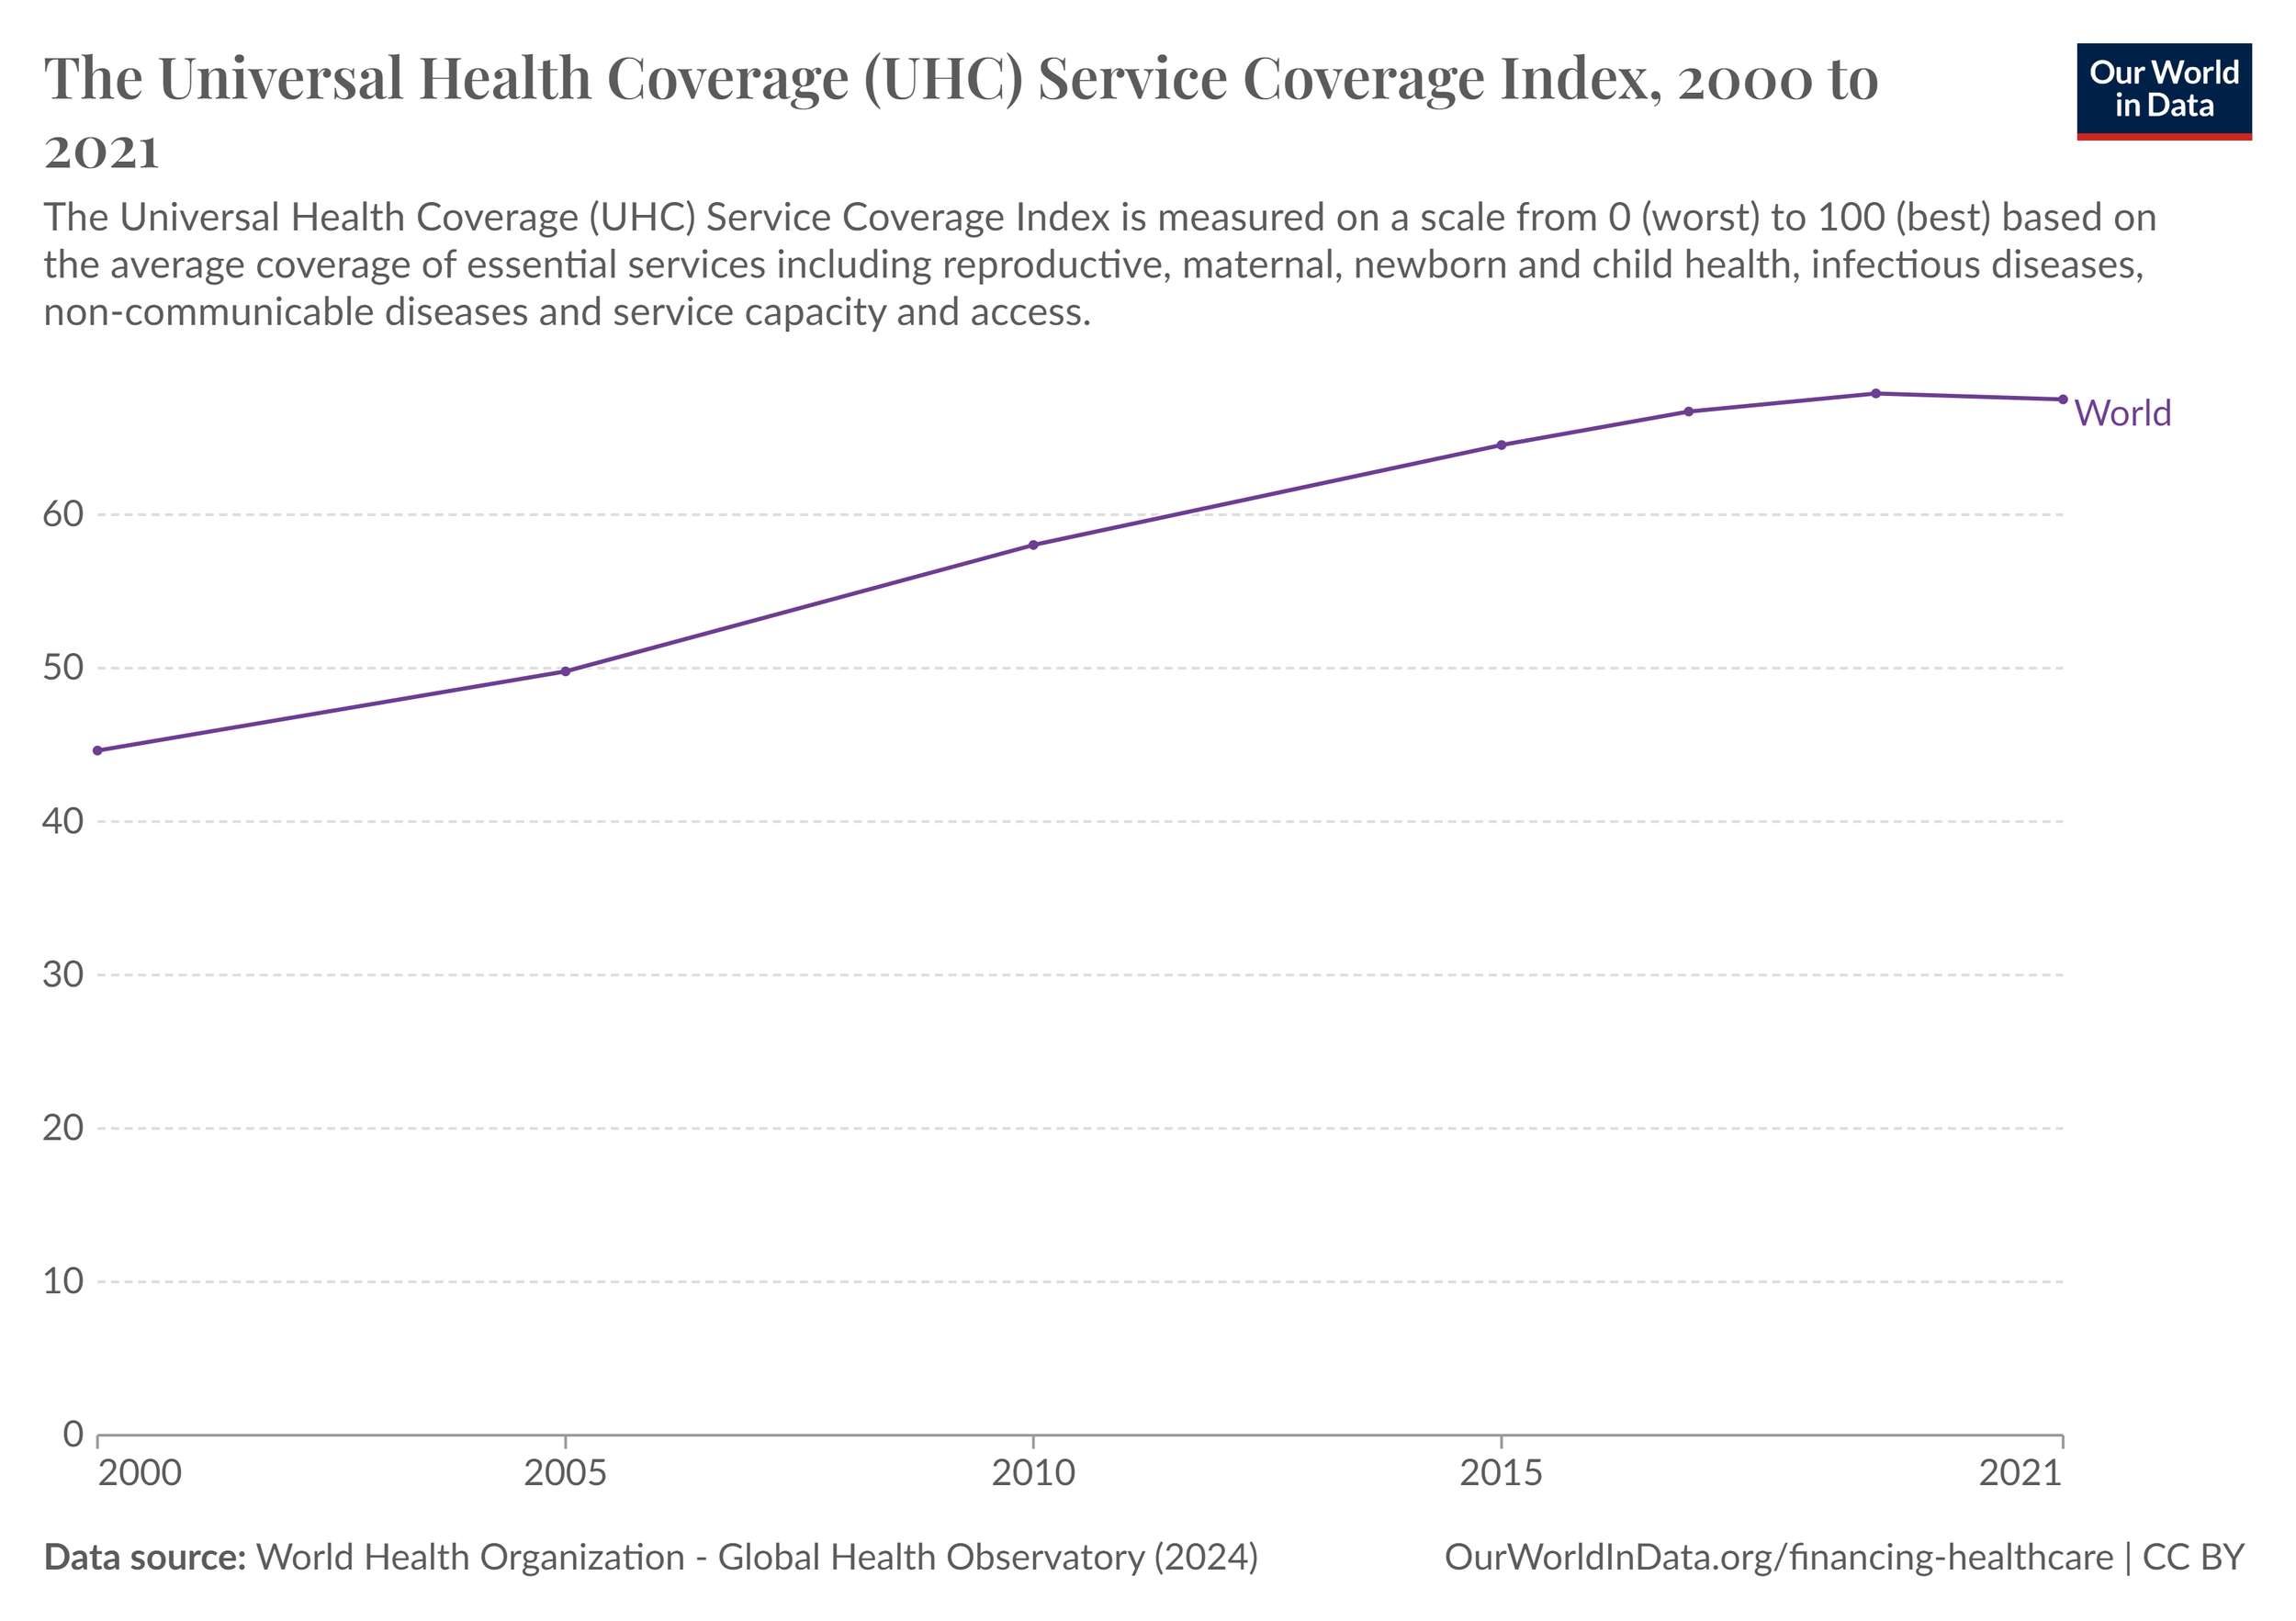
These respective indicators form an aggregate index of coverage of essential health services, on a scale of 0 to 100, the measure used for indicator 3.8.1.

The second indicator for this target measures the proportion of household income spent on healthcare, using a method used by the UN called Classification of Individual Consumption According to Purpose (COICOP), which categorises the purpose of household expenditure, including health care goods and services.

By this measure, two thresholds are used to measure financial hardship, the lower one for 10% of household income spent on healthcare, and the higher threshold for a quarter of household income spent on healthcare.

For the purposes of Indicator 3.8.2, this measure is used at a population level to measure the percentage of people meeting either the lower or higher thresholds of 10 or 25% household income spent on healthcare, placing them at financial risk to pay for their healthcare needs. 

As of 2021, the world result for the index of coverage of essential health services stands at 67 out of a score of 100, still far from the 2030 goal of universal health coverage, the aim of SDG #3 overall.

As of 2019, the share of the world population with more than a quarter of household expenditure spent on health stands at 3%.

SDG Target #3.7

SDG #3 is to “To ensure healthy lives and promote well-being for all at all ages.”

Within SDG #3 are 13 targets, of which we here focus on Target 3.7:

By 2030, ensure universal access to sexual and reproductive health-care services, including for family planning, information and education, and the integration of reproductive health into national strategies and programs

Target 3.7 has two indicators:

  • Indicator 3.7.1: Percentage of married women ages 15–49 years whose need for family planning is satisfied with modern methods of contraception.

  • Indicator 3.7.2: Adolescent birth rate (aged 10–14 years; aged 15–19 years) per 1,000 women in that age group.

This target links both to Target 3.8, which we’ll look at next, relating to universal healthcare coverage, as well as Target 5.6, under the gender equality Goal for universal sexual and reproductive health.

The UN agency overseeing sexual and reproductive health is the UNFPA, otherwise known as the UN Population Fund, as well as the Population Division of the UN Department of Economic and Social Affairs.

To help meet the rights to access affordable and quality sexual and reproductive health services and information, the World Health Organisation has published a Family Planning guidance handbook for use by health care professionals about providing contraceptive methods and services in low- and middle-income countries, including for those adolescent and women at high risk of the HIV epidemic.

One example of a method profiled in the Family Planning handbook is the mini-pill, also known as norethindrone, a birth-control pill belonging to the class of medications called progestins, which are synthetic compounds which act like the steroid hormone made by the body called progesterone to maintain pregnancy and prevents further ovulation. 

The consequences of failing to acknowledge the unmet demand for contraceptives in the least developed countries put these regions at further risk of food insecurity due to the population explosion it invites, which will require even greater levels of foreign aid to feed more mouths. 

The phenomenon by which fertility rates are reduced in the least developed countries, in turn slowing down the rapid rise of populations, is known as the ‘demographic transition’. Meeting family planning and contraceptive needs is a key pillar of this transition in countries which already often lack healthcare coverage, and are characterised by high maternal and child mortality rates, sometimes also accompanied by high HIV rates. 

This brings us to the second indicator for this target, regarding adolescent birth rates. The global agenda for this intersection of population and development is epitomised in the Programme of Action, adopted at the International Conference on Population and Development in Cairo in 1994.

One of challenges of measuring the ages of mothers giving birth in the regions experiencing the highest rates of adolescent fertility rates are they’re sometimes out of reach of civil registration of live births.

As of 2023, 77% of the share of women throughout the world’s family planning needs were met, still short of the universal access objective of target #3.7. 

The adolescent birth rate, as of 2023, is 1.5 births per 1,000 to 10-14-year-olds worldwide.


SDG Target #3.6

SDG #3 is to “To ensure healthy lives and promote well-being for all at all ages.”

Within SDG #3 are 13 targets, of which we here focus on Target 3.6:

By 2020, halve the number of global deaths and injuries from road traffic accidents 

Target 3.6 has one indicator:

  • Indicator 3.6.1: Death rate due to road traffic injuries

According to WHO data, as of 2019, the death rate from road traffic injuries has reduced only 0.3 per 100,00 people worldwide, from 17 deaths per 100,000 in 2015, clearly missing this target for 2020, 10 years ahead of the SDGs in total.

SDG Target #3.5

SDG #3 is to “To ensure healthy lives and promote well-being for all at all ages.”

Within SDG #3 are 13 targets, of which we here focus on Target 3.5:

Strengthen the prevention and treatment of substance abuse, including narcotic drug abuse and harmful use of alcohol.

Target 3.5 has two indicators:

  • Indicator 3.5.1: Coverage of treatment interventions (pharmacological, psychosocial and rehabilitation and aftercare services) for substance use disorders

  • Indicator 3.5.2: Alcohol per capita consumption (aged 15 years and older) within a calendar year in litres of pure alcohol

The UN agency overseeing the topic of substance abuse is the UNODC, or the UN Office on Drugs and Crime, as well as the WHO. There are three main International Drug Control Conventions:

On the treatment side of the topic of substance abuse, the WHO and UNODC have formulated a set of International Standards for the Treatment of Drug Use Disorders to support UN Member States to treat drug use disorders in an ethical, evidence-based way. To support member states' in relation to alcohol use, the World Health Organisation has published the International Guide for Monitoring Alcohol Consumption and Related Harm.

The World Health Organisation collects data for all Member States for per capita alcohol consumption for those aged over 15, with the leaders being Romania, Georgia and Czech Republic, with between 13-15 litres of pure alcohol per capita. The WHO and UNODC further estimate over 2 billion people worldwide drink alcohol.

SDG Target #3.4

SDG #3 is to “To ensure healthy lives and promote well-being for all at all ages.”

Within SDG #3 are 13 targets, of which we here focus on Target 3.4:

By 2030, reduce by one third premature mortality from non-communicable diseases through prevention and treatment and promote mental health and well-being

Target 3.4 has two indicators:

  • Indicator 3.4.1: Mortality rate attributed to cardiovascular disease, cancer, diabetes or chronic respiratory disease 

  • Indicator 3.4.2: Suicide mortality rate 

Non-communicable diseases are those diseases for which a pathogen is not responsible for the transmission of the disease, infecting the host, such as parasites. As indicator 3.4.1 makes clear, the most well-known non-communicable diseases are those affecting the heart and blood vessels, diabetes, cancer, and respiratory diseases such as chronic obstructive lung disease. To measure well-being, or quality of life, and the mental aspects thereof, the official UN indicator for the total opposite of wellbeing, suicide, is used as the measure.

To measure both indicators in this target, the World Health Organisation compiles mortality data within its Mortality Index, based upon the reporting of Member States. Complementing SDG #3 in the fight against non-communicable diseases is the NCD Global Monitoring Framework, which like the SDGs, is a framework of goals and indicators adopted by the member countries of the WHO’s World Health Assembly in 2013 for the prevention and control of non-communicable diseases.

As of 2019, the expected share of deaths of non-communicable diseases for the world is 18%, down 1% from 2015, far from the target to reduce by one-third premature mortality from non-communicable diseases.

The global suicide rate in 2019 is 9.1 deaths per 100,000 people, down only by a fraction since 2015, however target 3.4’s wording of “promoting mental health and wellbeing” does not provide a target with which this indicato should be reduced by.

SDG Target #3.3

SDG #3 is to “To ensure healthy lives and promote well-being for all at all ages.”

Within SDG #3 are 13 targets, of which we here focus on Target 3.3:

By 2030, end the epidemics of AIDS, tuberculosis, malaria and neglected tropical diseases and combat hepatitis, water-borne diseases and other communicable diseases.

Target 3.3 has five indicators:

  • Indicator 3.3.1: Number of new HIV infections per 1,000 uninfected population

  • Indicator 3.3.2: Tuberculosis per 100,000 population

  • Indicator 3.3.3: Malaria incidence per 1,000 population

  • Indicator 3.3.4: Hepatitis B incidence per 100,000 population

  • Indicator 3.3.5: Number of people requiring interventions against neglected tropical disease 

Looking first at HIV/AIDS, this infection is caused by a type of retrovirus characterised by its ability to survive inside its hosts for long incubation periods. The nature of retroviruses is they copy their RNA into the DNA of a host, thus changing the genome.  

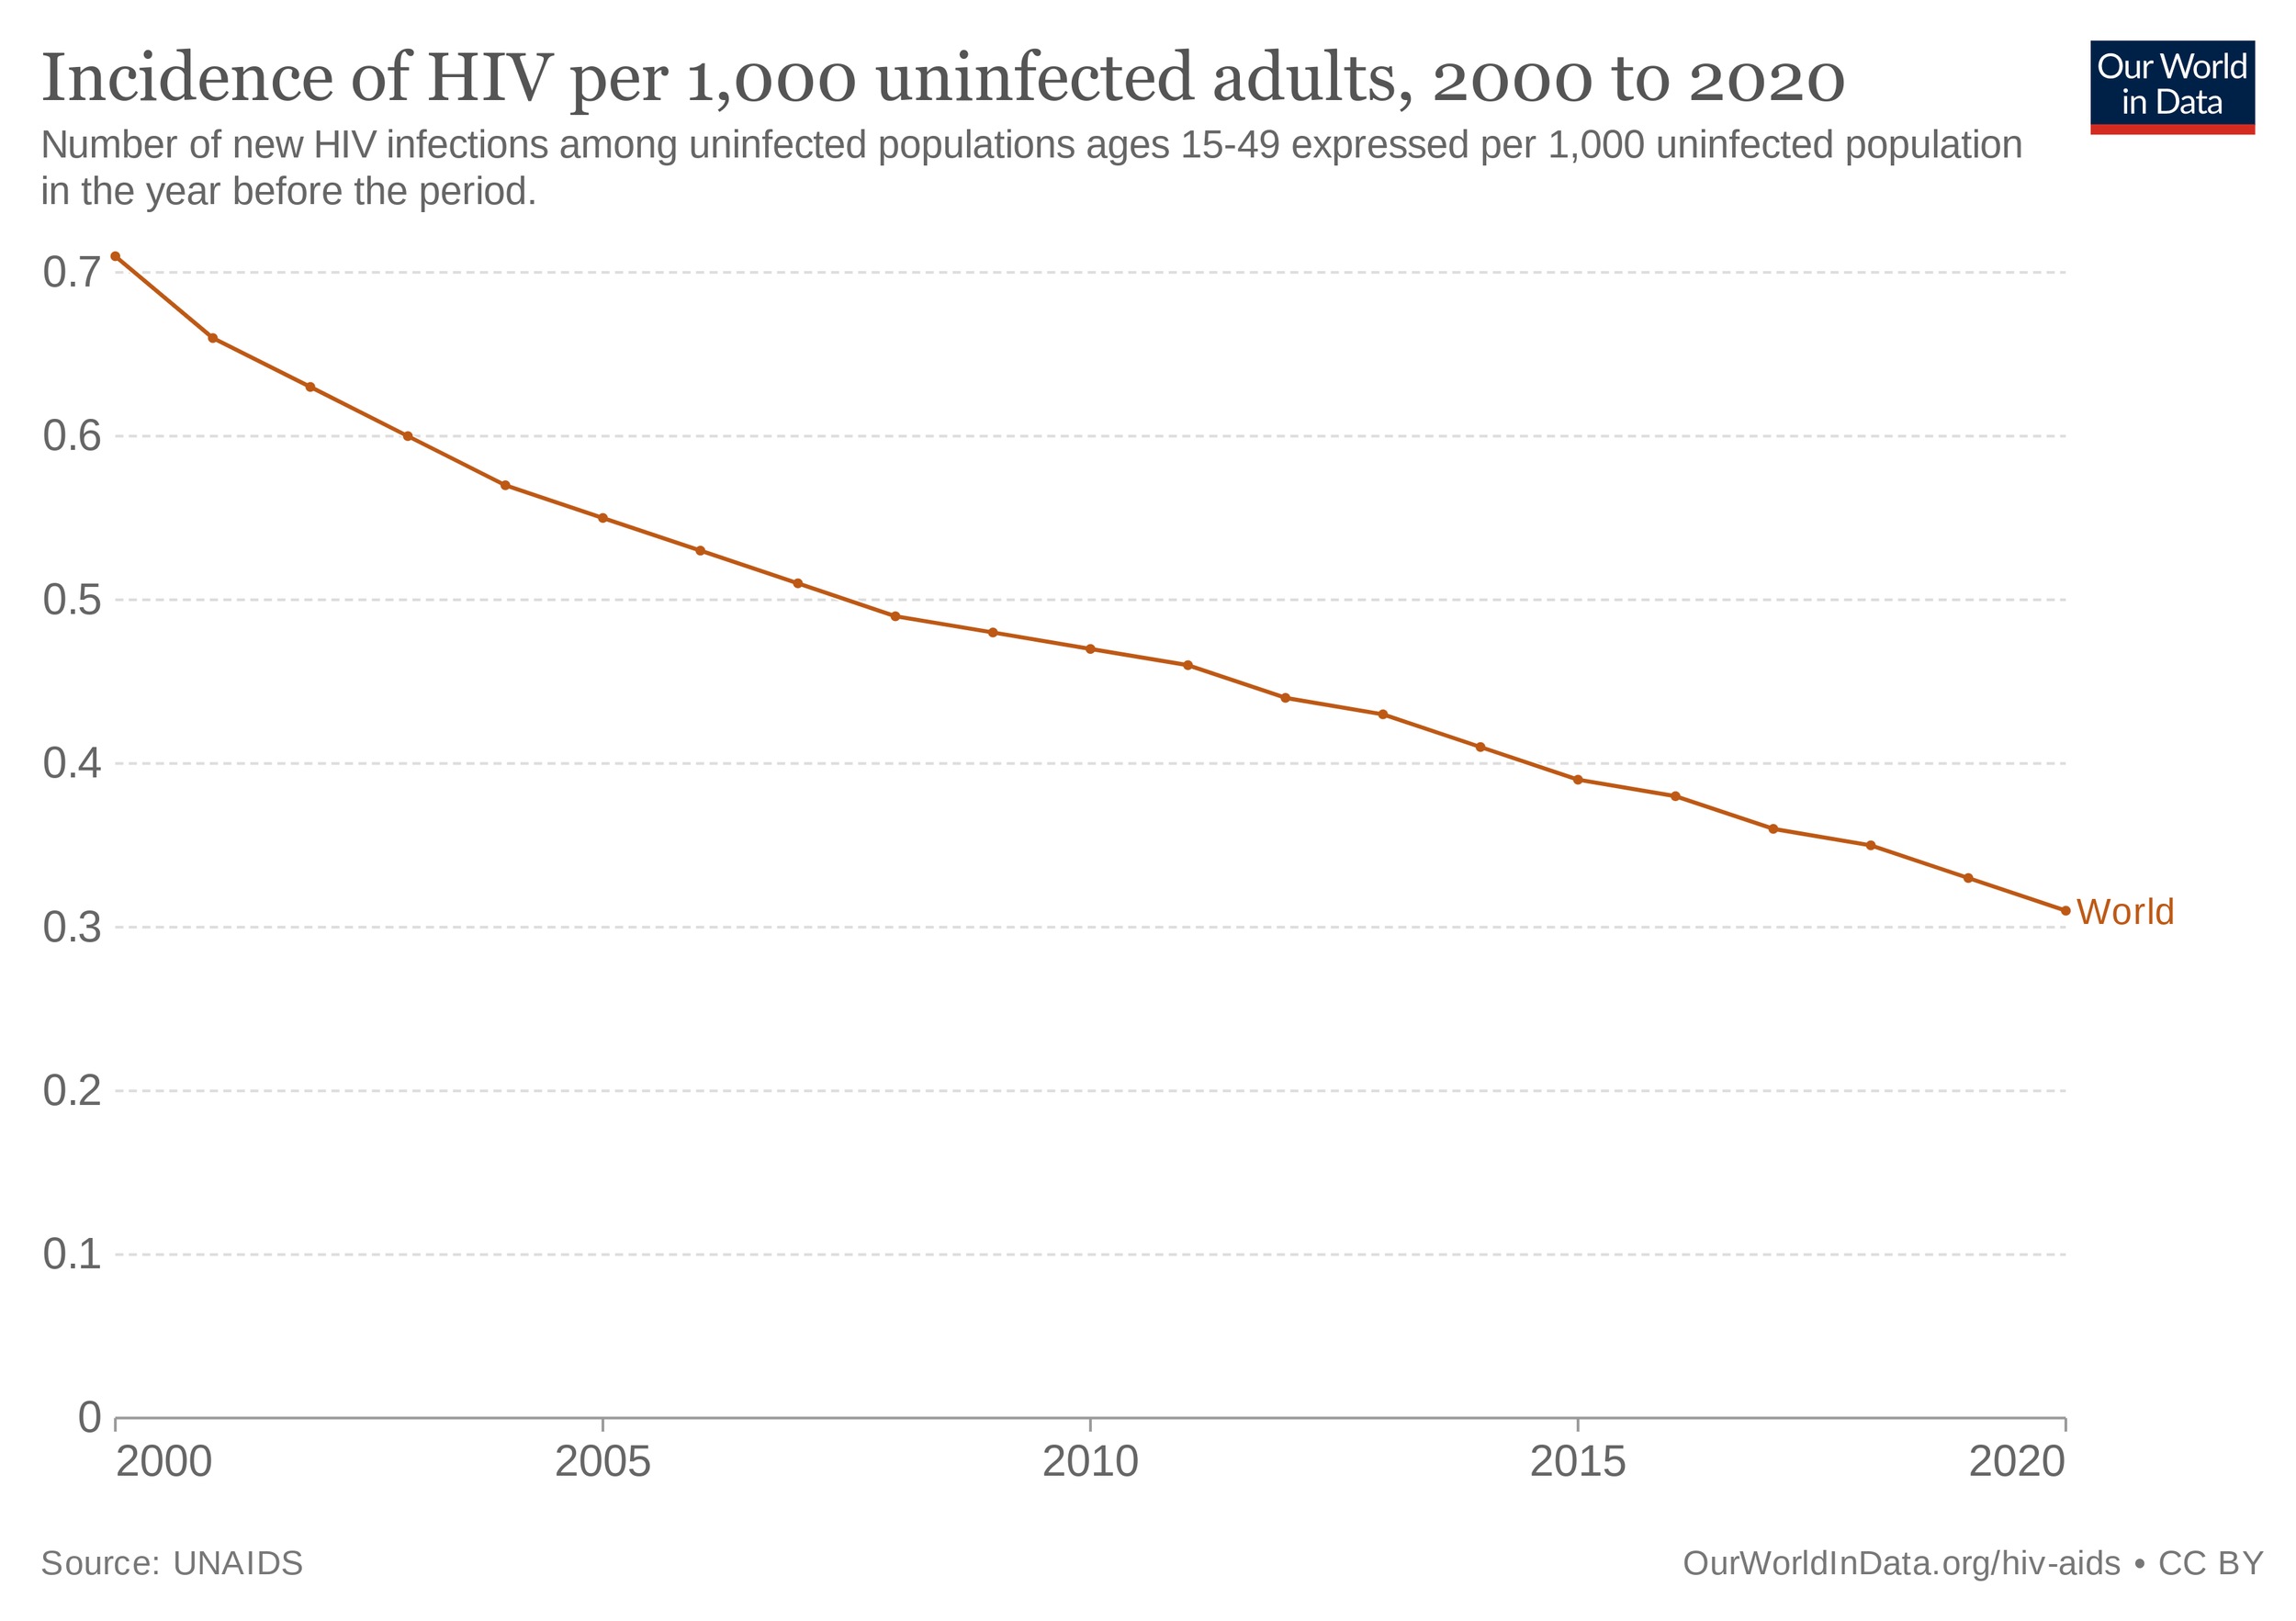
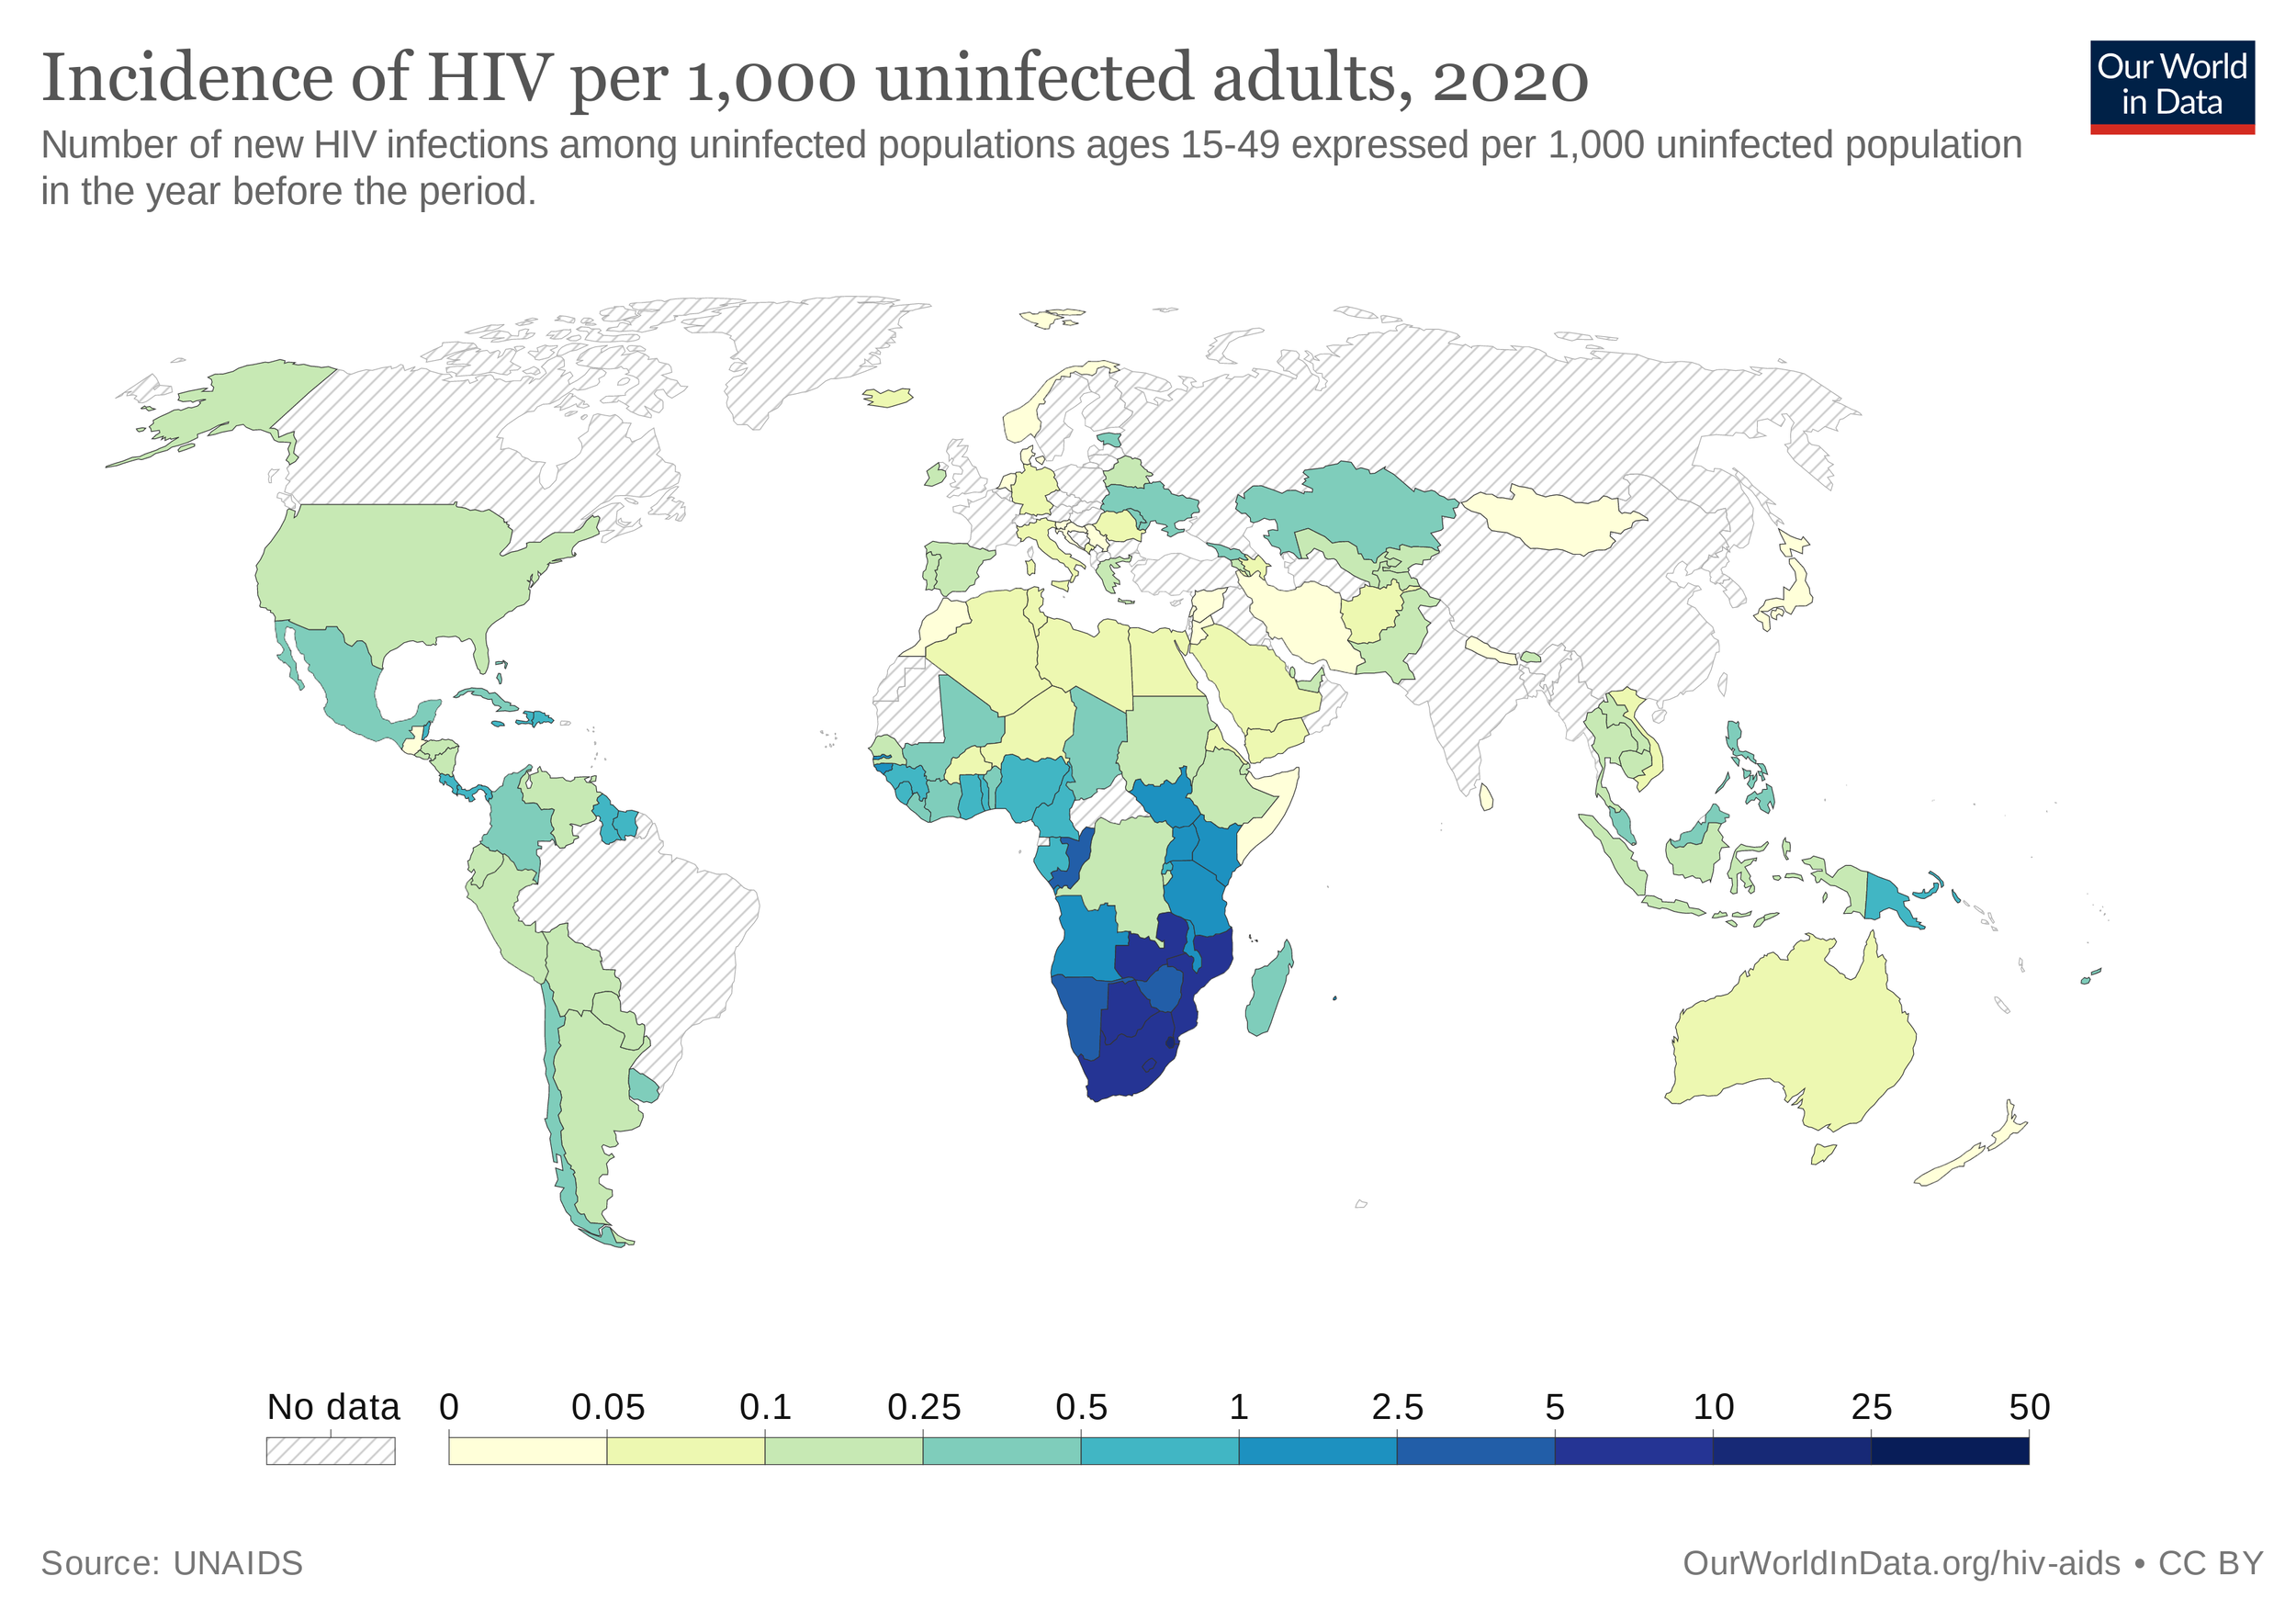
The UN agency overseeing the HIV/AIDS pandemic is the Joint UN Programme on HIV/AIDS, or UNAIDS for short, and is a joint effort of several UN agencies. 1.5 million people contract AIDS per year, resulting in 680,000 deaths in the latest year of data, with 38 million people living with the virus. A High-Level Meeting on AIDS declared the UN’s intent to end AIDS by 2030, in alignment with SDG Target #3.3. However another major pandemic, COVID-19, has slowed progress, with a current global rate of 0.19 new HIV infections per 1000 uninfected people, short of the 2030 goal for elimination of HIV. 

Turning next to tuberculosis, this is caused by infection of a pathogenic bacteria called Mycobacterium tuberculosis, transmitted between people via respiratory means. The bacteria causes 10.6 million people a year to fall ill, killing 1.6 million people in 2021

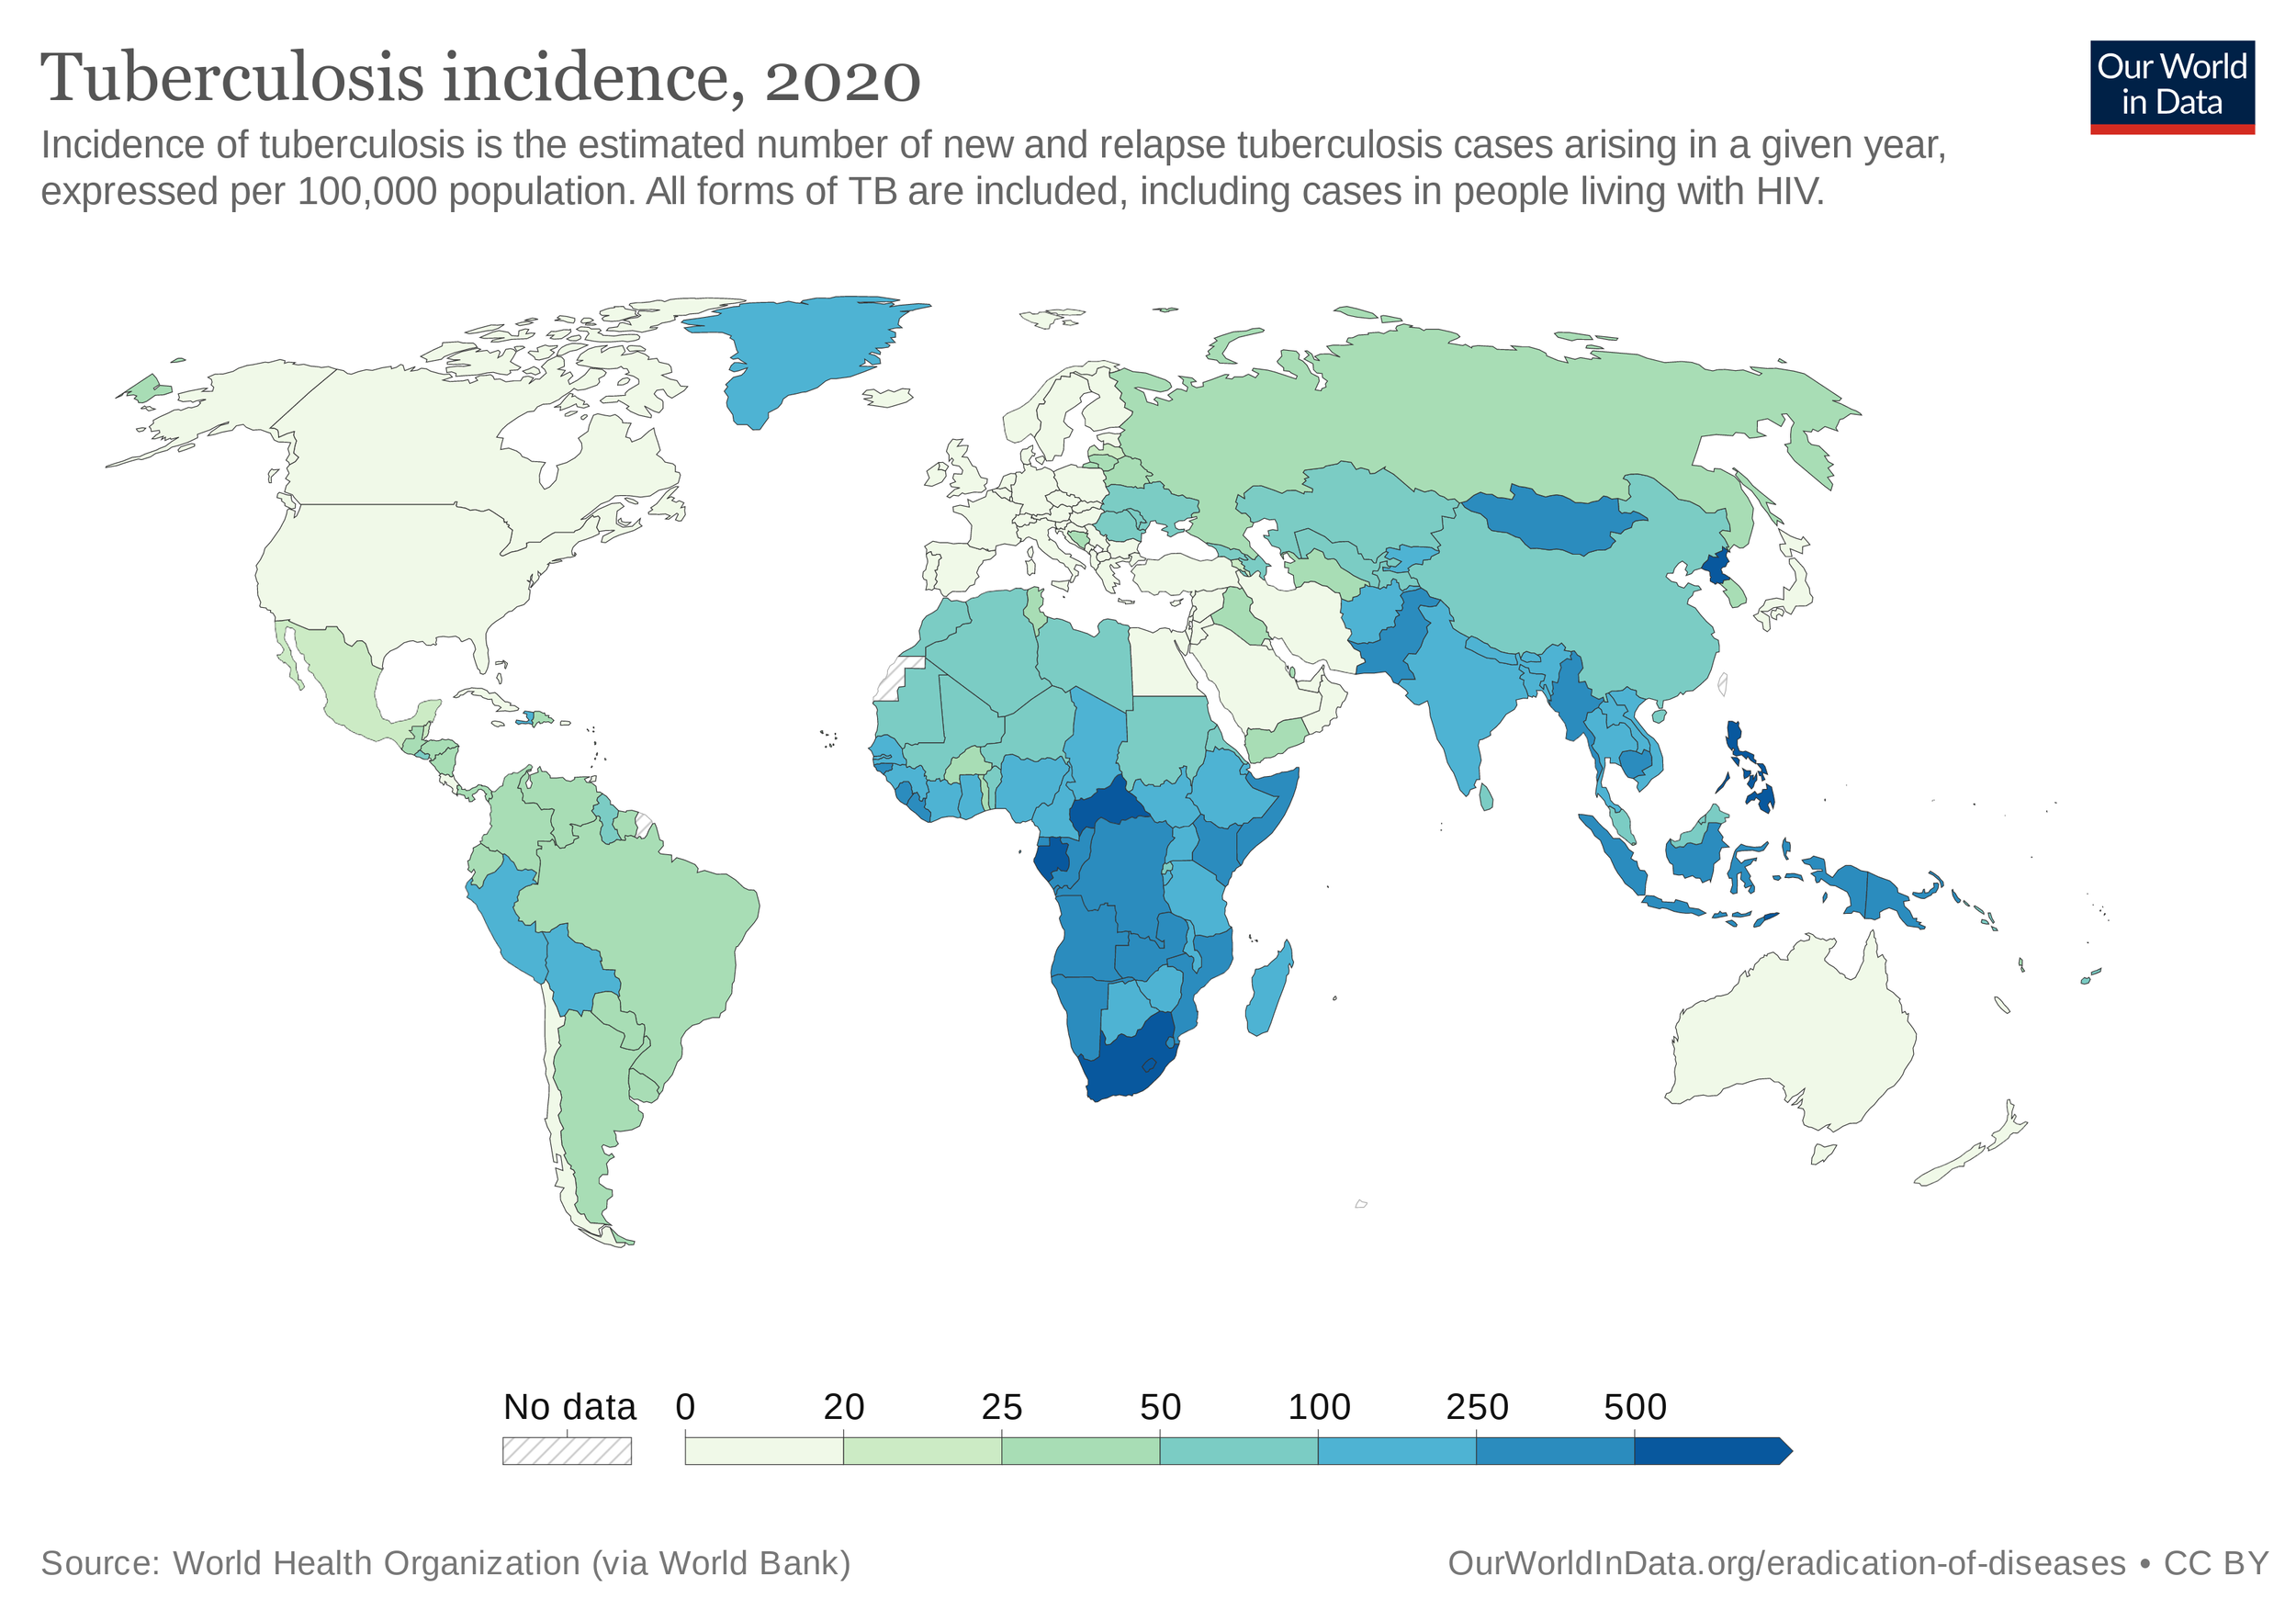
Within the World Health Organisation, the Global Tuberculosis Programme works toward ridding the world of TB from its current world level of an incidence of 127 TB cases per population of 100,000, down from 142 per 100,000 in 2015 at the start of the SDG period, and 174 in 2000, at the beginning of the MDG period. This was encapsulated in MDG #6 to “combat HIV/AIDS, malaria and other diseases”, and which aimed to halve the incidence of AIDS, malaria and TB by 2015, and reverse their incidence.

The world benefits from efforts such as the End TB Transmission Initiative, as part of the Stop TB Partnership, administered by the UN. Other impressive organisations in the fight against TB as well as AIDS, which are often co-morbidities alongside one another, include the The Global Fund to Fight AIDS, Tuberculosis and Malaria, Unitaid and IFFIm, in partnership with Gavi, the Vaccine Alliance.

One of the main strategies the WHO endorses for combating TB is DOTS, which stands for directly-observed treatment, short course, whereby a healthcare worker watches the patient take their dose. Immunisation with a TB vaccine is a widespread method of prevention. However, hampering global efforts to control and prevent TB are strains of TB resistant to drugs developed to treat the disease.

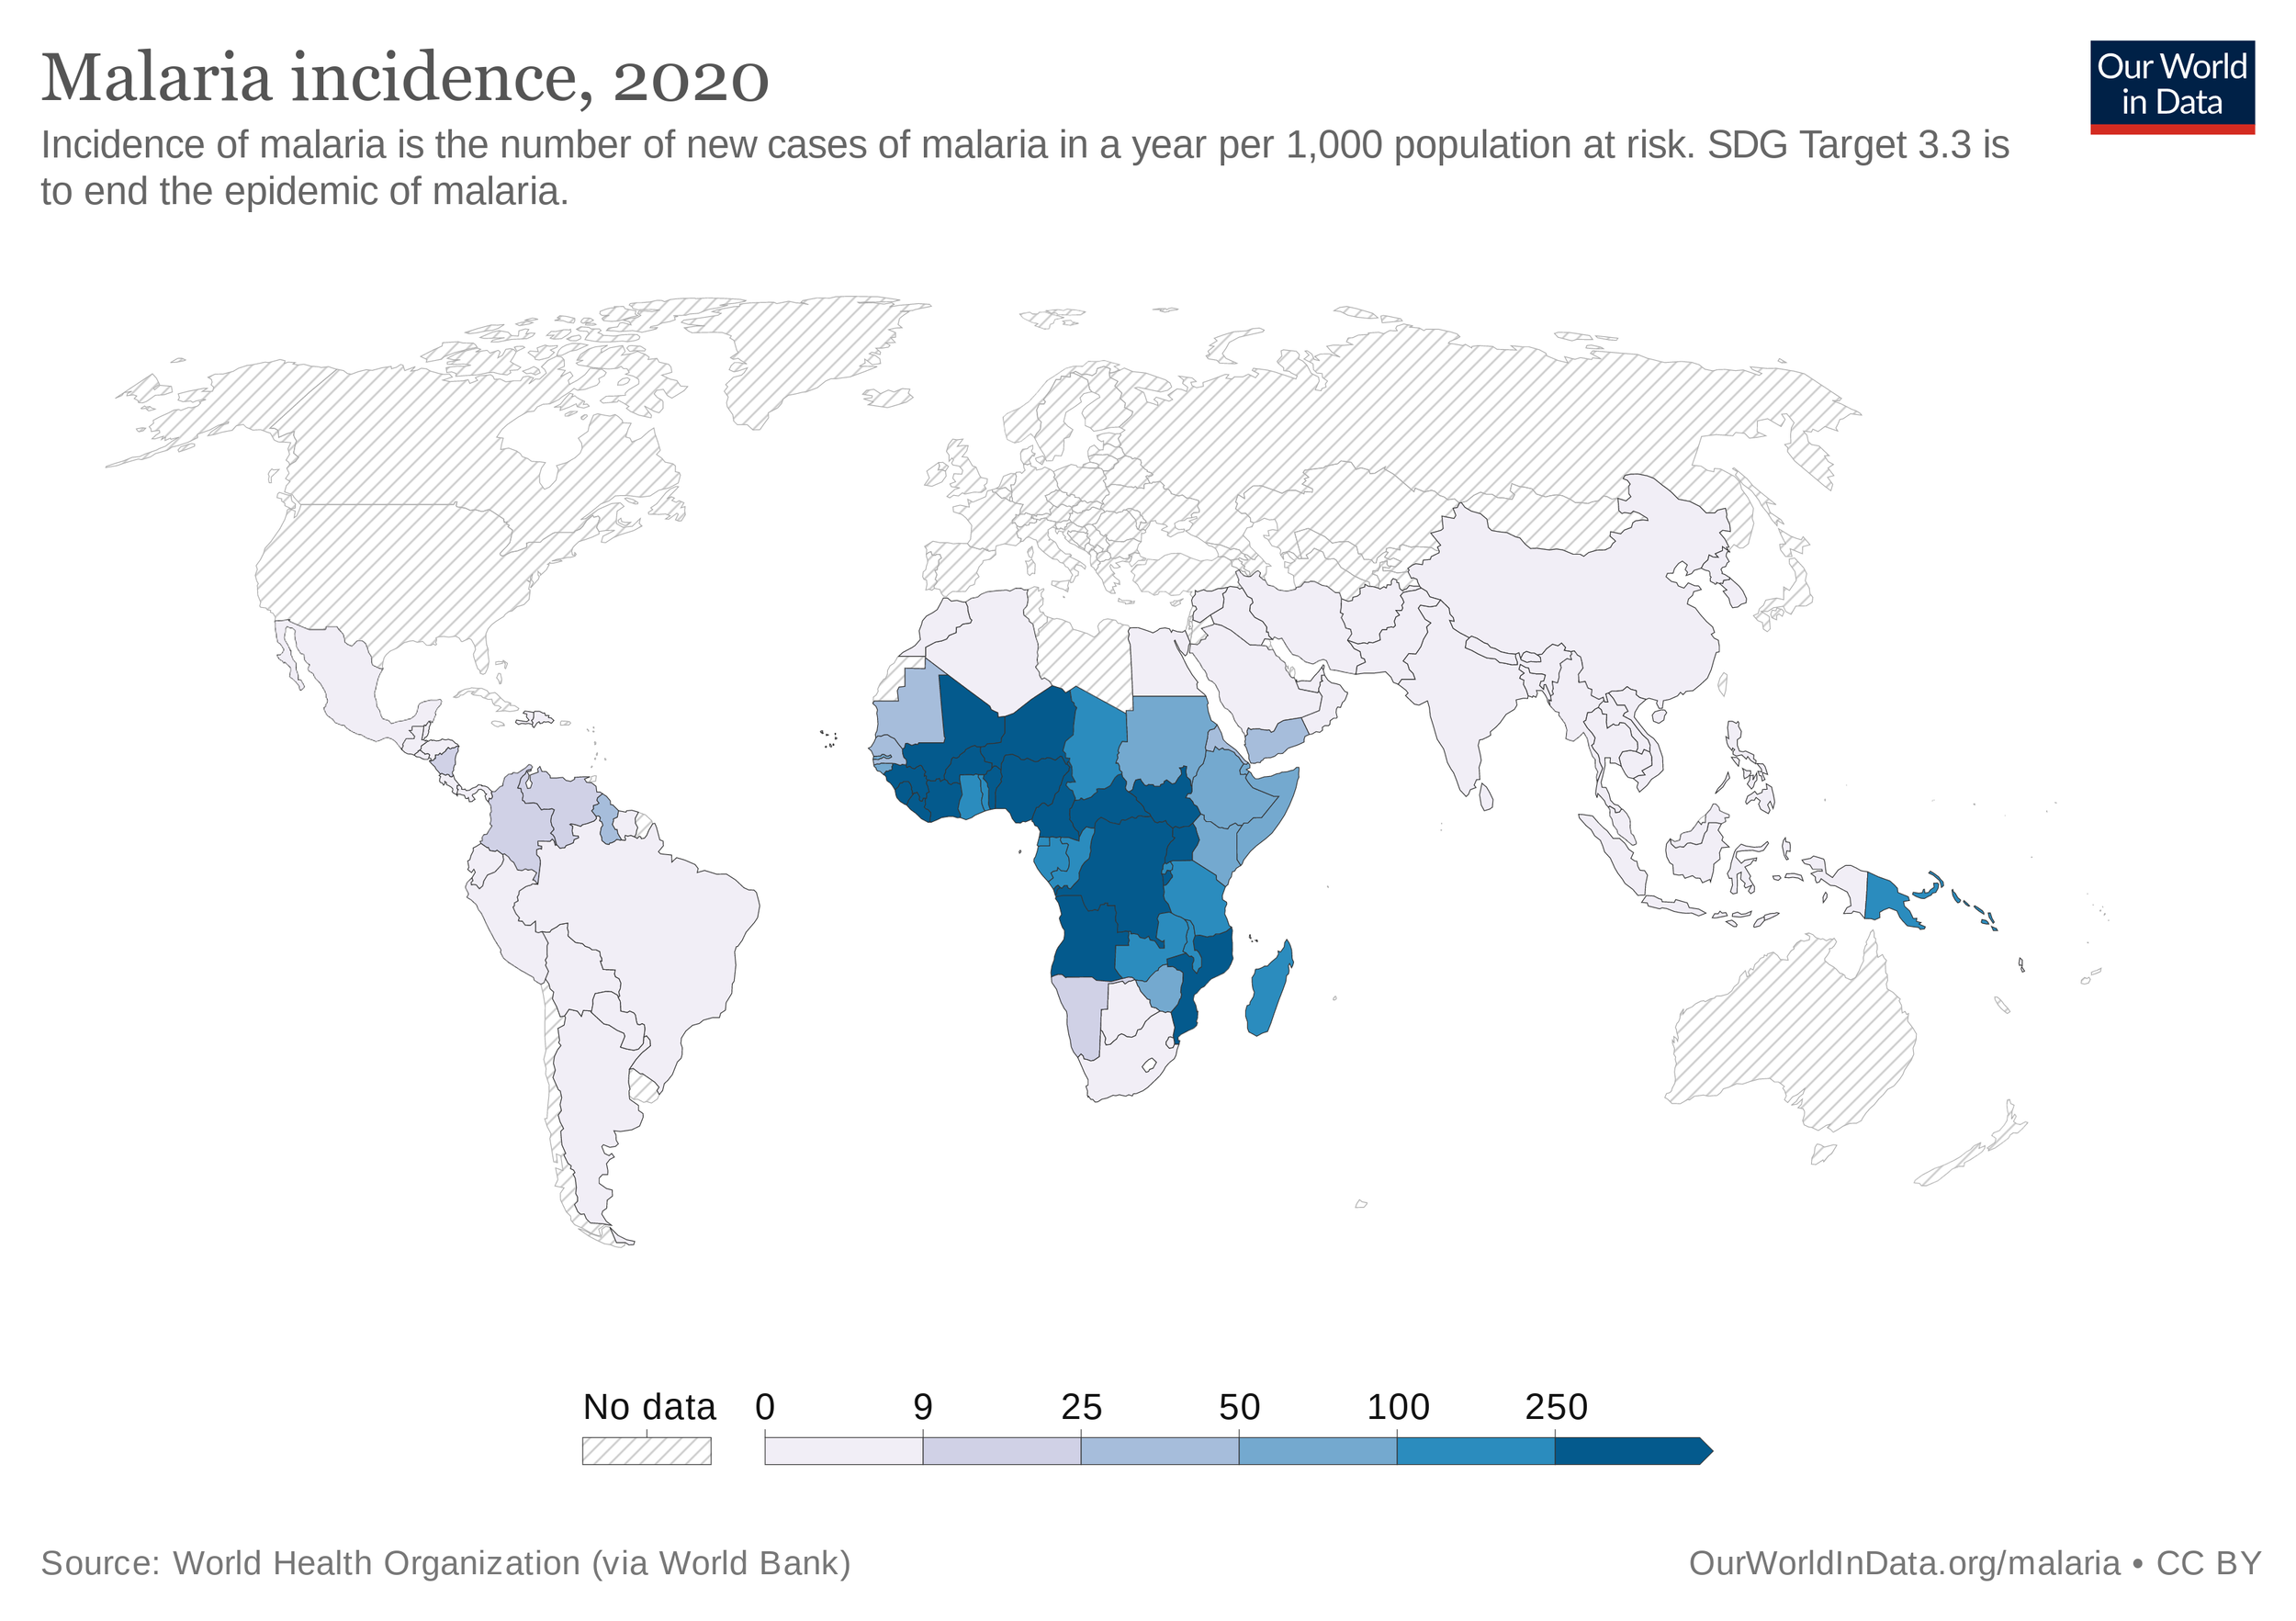
Alongside AIDS and TB, in 2020 there were 241 million cases malaria, resulting in 627,000 deaths. The mosquito-borne disease affects Africa to a disproportionate level, where it’s home to almost all cases and deaths. In the effort to end the malaria pandemic, the world is still shy of the mark, with an incidence of 59 new cases per 1,000 of the global population.

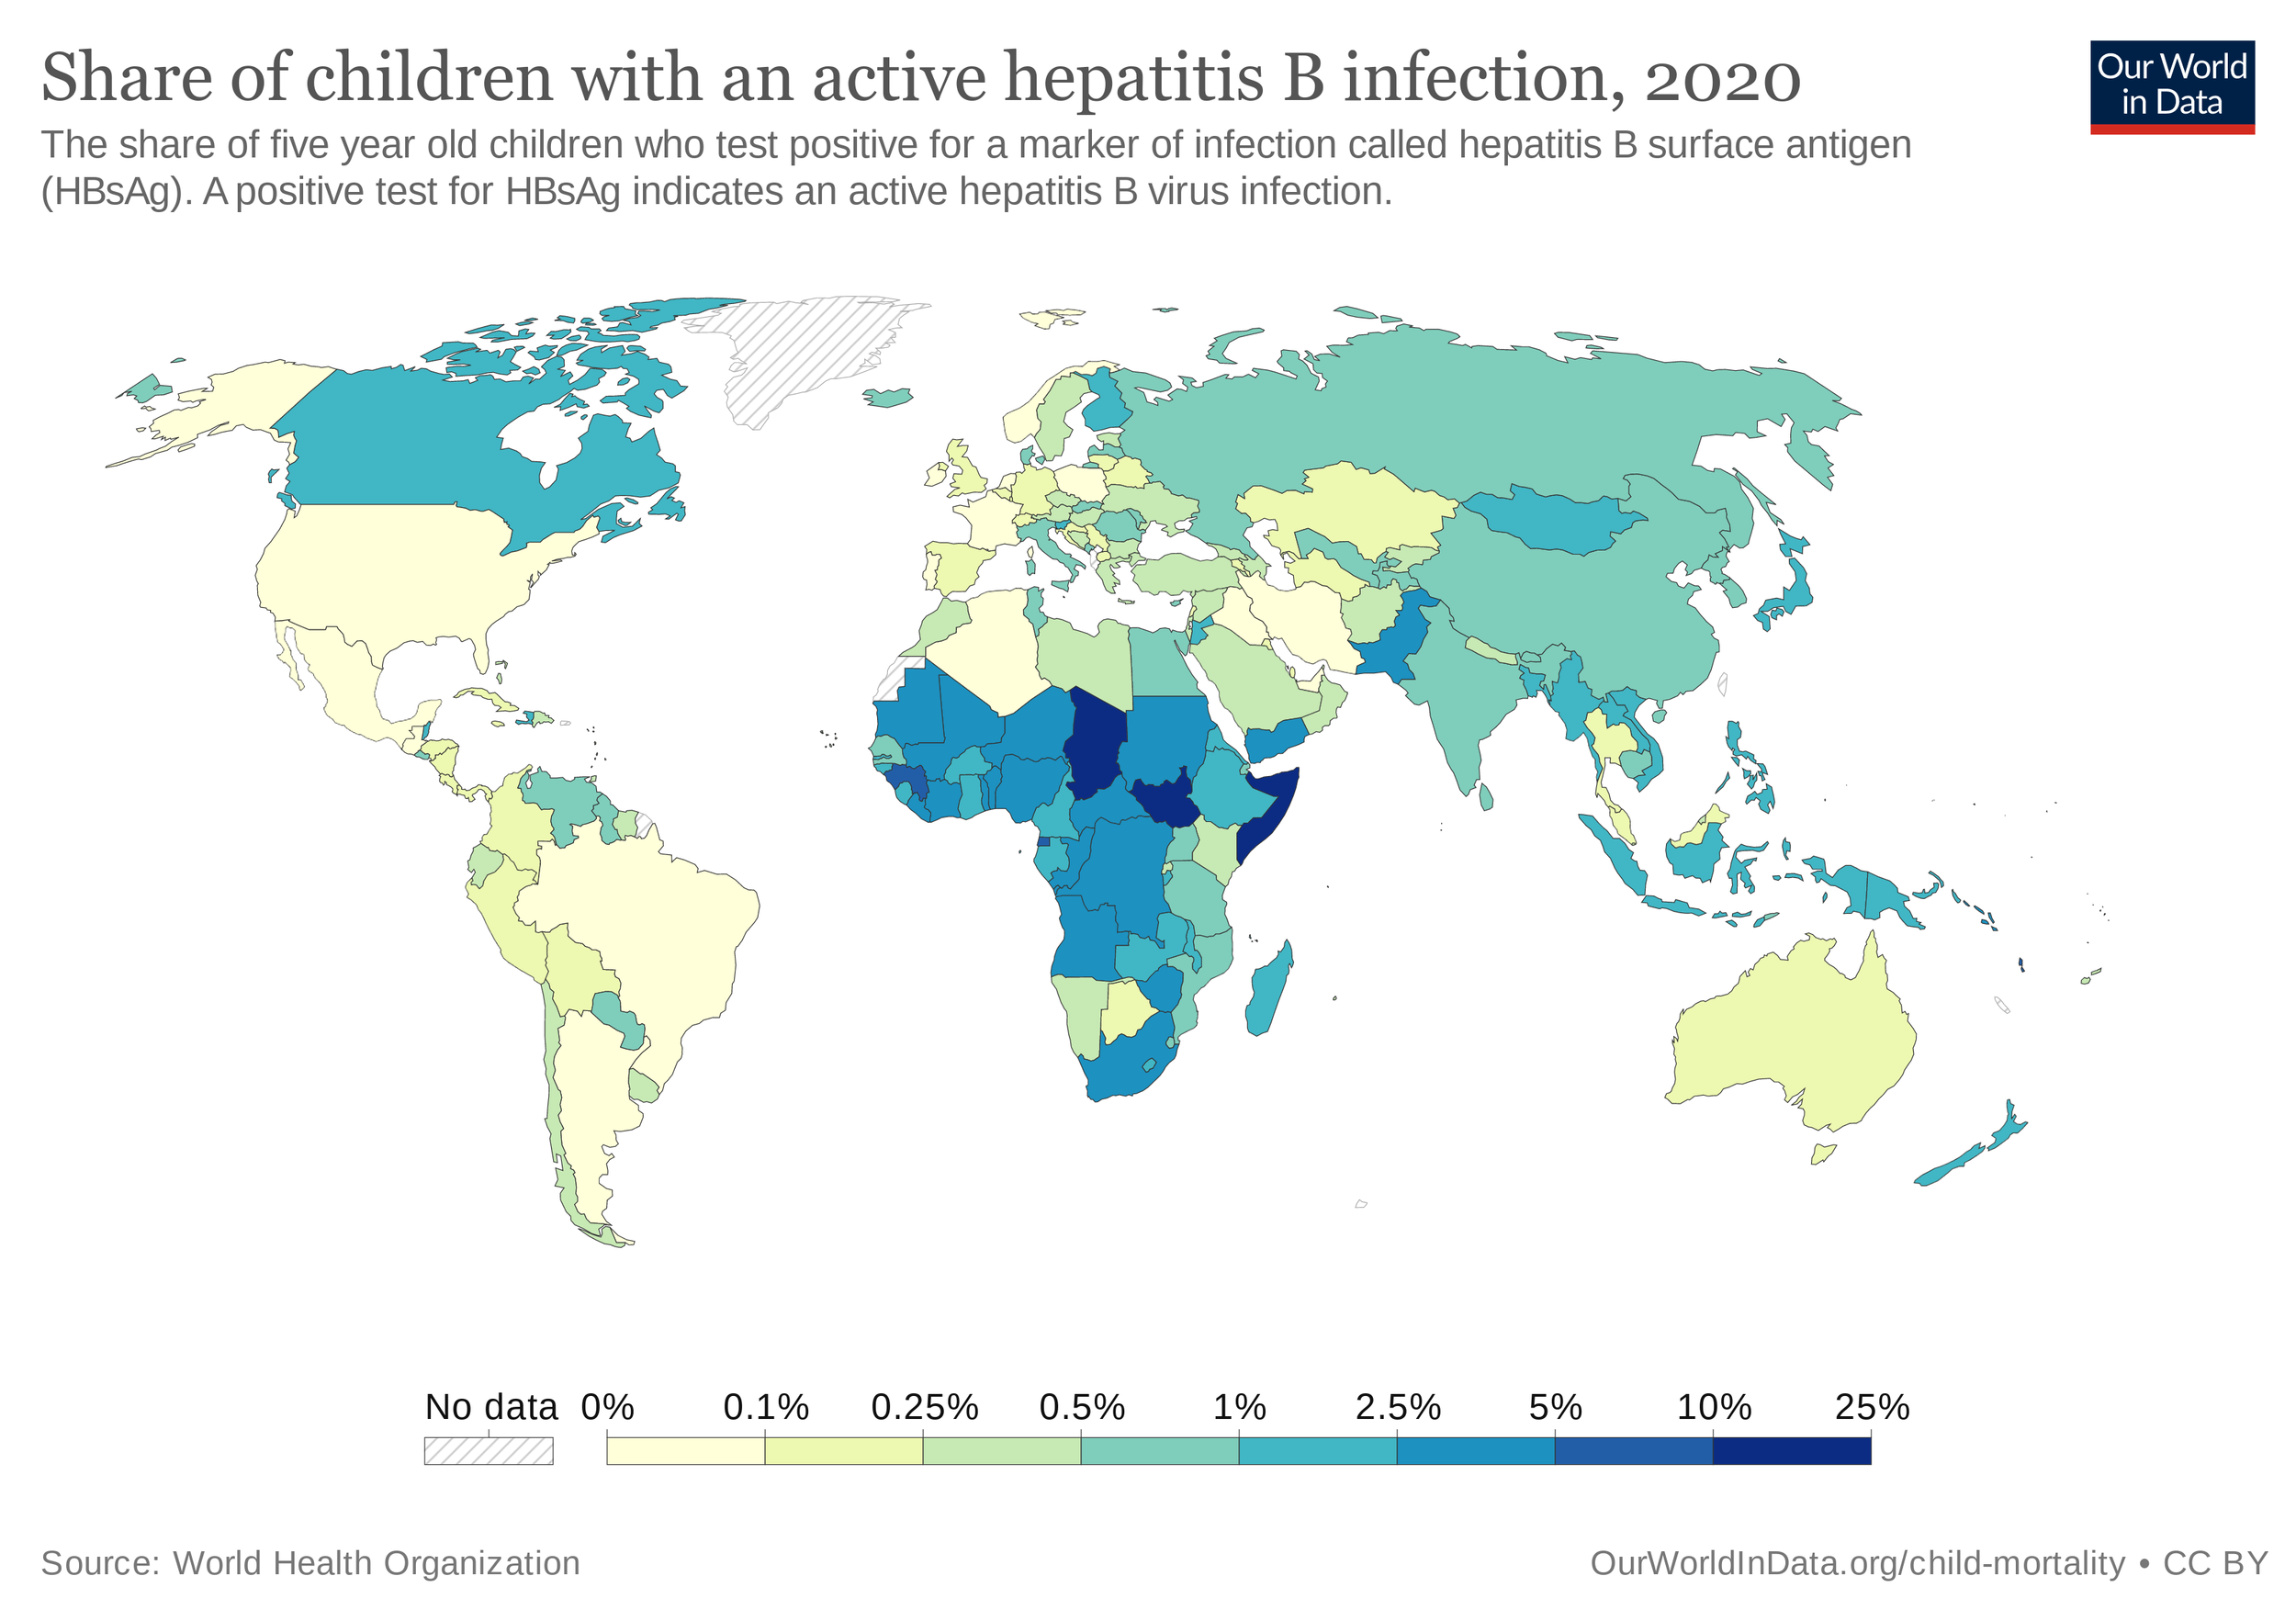
The following indicator focuses upon hepatitis B. Hepatitis is a disease characterised by inflammation of the liver. Hepatitis B is a viral type of hepatitis, caused by infection of the hepatitis B virus. Immunisations are an effective tool deployed worldwide to prevent the spread of the hepatitis B virus. The world isn’t too far away from eliminating this disease, with less than 1% of children under-5 worldwide testing positive for an active case of hepatitis B.

For the final indicator of this target, we look to neglected tropical diseases, which are infectious diseases common to developing countries in the tropics and subtropics of Africa, Asia and the Americas. So what are these neglected tropical diseases we’re aiming to control by 2030?

These include about 20 infectious diseases, so let’s parse through some which may be less than household names, many of which are water-borne diseases:

  • Lymphatic filariasis is caused by parasitic worms, microscopic in size, affecting the lymphatic system.

  • Schistosomiasis is another infection caused by parasitic worms

  • Soil-transmitted helminthiasis is a disease caused by another parasitic worm, in this case observable to the human eye, infecting the intestines, and transmissible via soil contaminated by these type of worms called helminths

  • Onchocerciasis, a disease of the eyes and skin, also caused by a worm

  • Buruli ulcer, an infection of the skin caused by a type of bacteria

  • Chagas disease, transmitted via a bug carrying a parasite called Trypanosoma cruzi

  • African sleeping sickness, also known as human African Trypanosomiasis, is similar to Chagas. Both are due to parasites belonging to the genus Trypanosoma, in this instance the species Trypanosoma brucei.

  • Leishmaniasis, a parasite spread by sandflies

  • Mycetoma, a bacterial and fungal infection, spread by the skin’s exposure to soil or water containing the bacteria or fungus causing this disease

  • Yaws, a chronic skin infection, resulting in small lumps and ulcers on the skin

  • Dracunculiasis, caused by the worm-like parasite species Dracunculus medinensis, also known as Guinea worm, so named because of the Gulf of Guinea in West Africa, where it was once prevalent.

  • Echinococcosis, caused by parasitic worms of the genus Echinocococcus. 

Also included among the neglected tropical diseases, is snake envenoming, caused by the toxins from a snakebite.

Various medications treating infection by some of the aforementioned parasitic worms include diethylcarbamazine, albendazole, mebendazole and praziquantel.

One of the preventive strategies endorsed by the WHO for some of the neglected tropical diseases caused by helminth worms is preventive chemotherapy, which is the safe administration of a medicine to a whole population susceptible to infection by these worms.

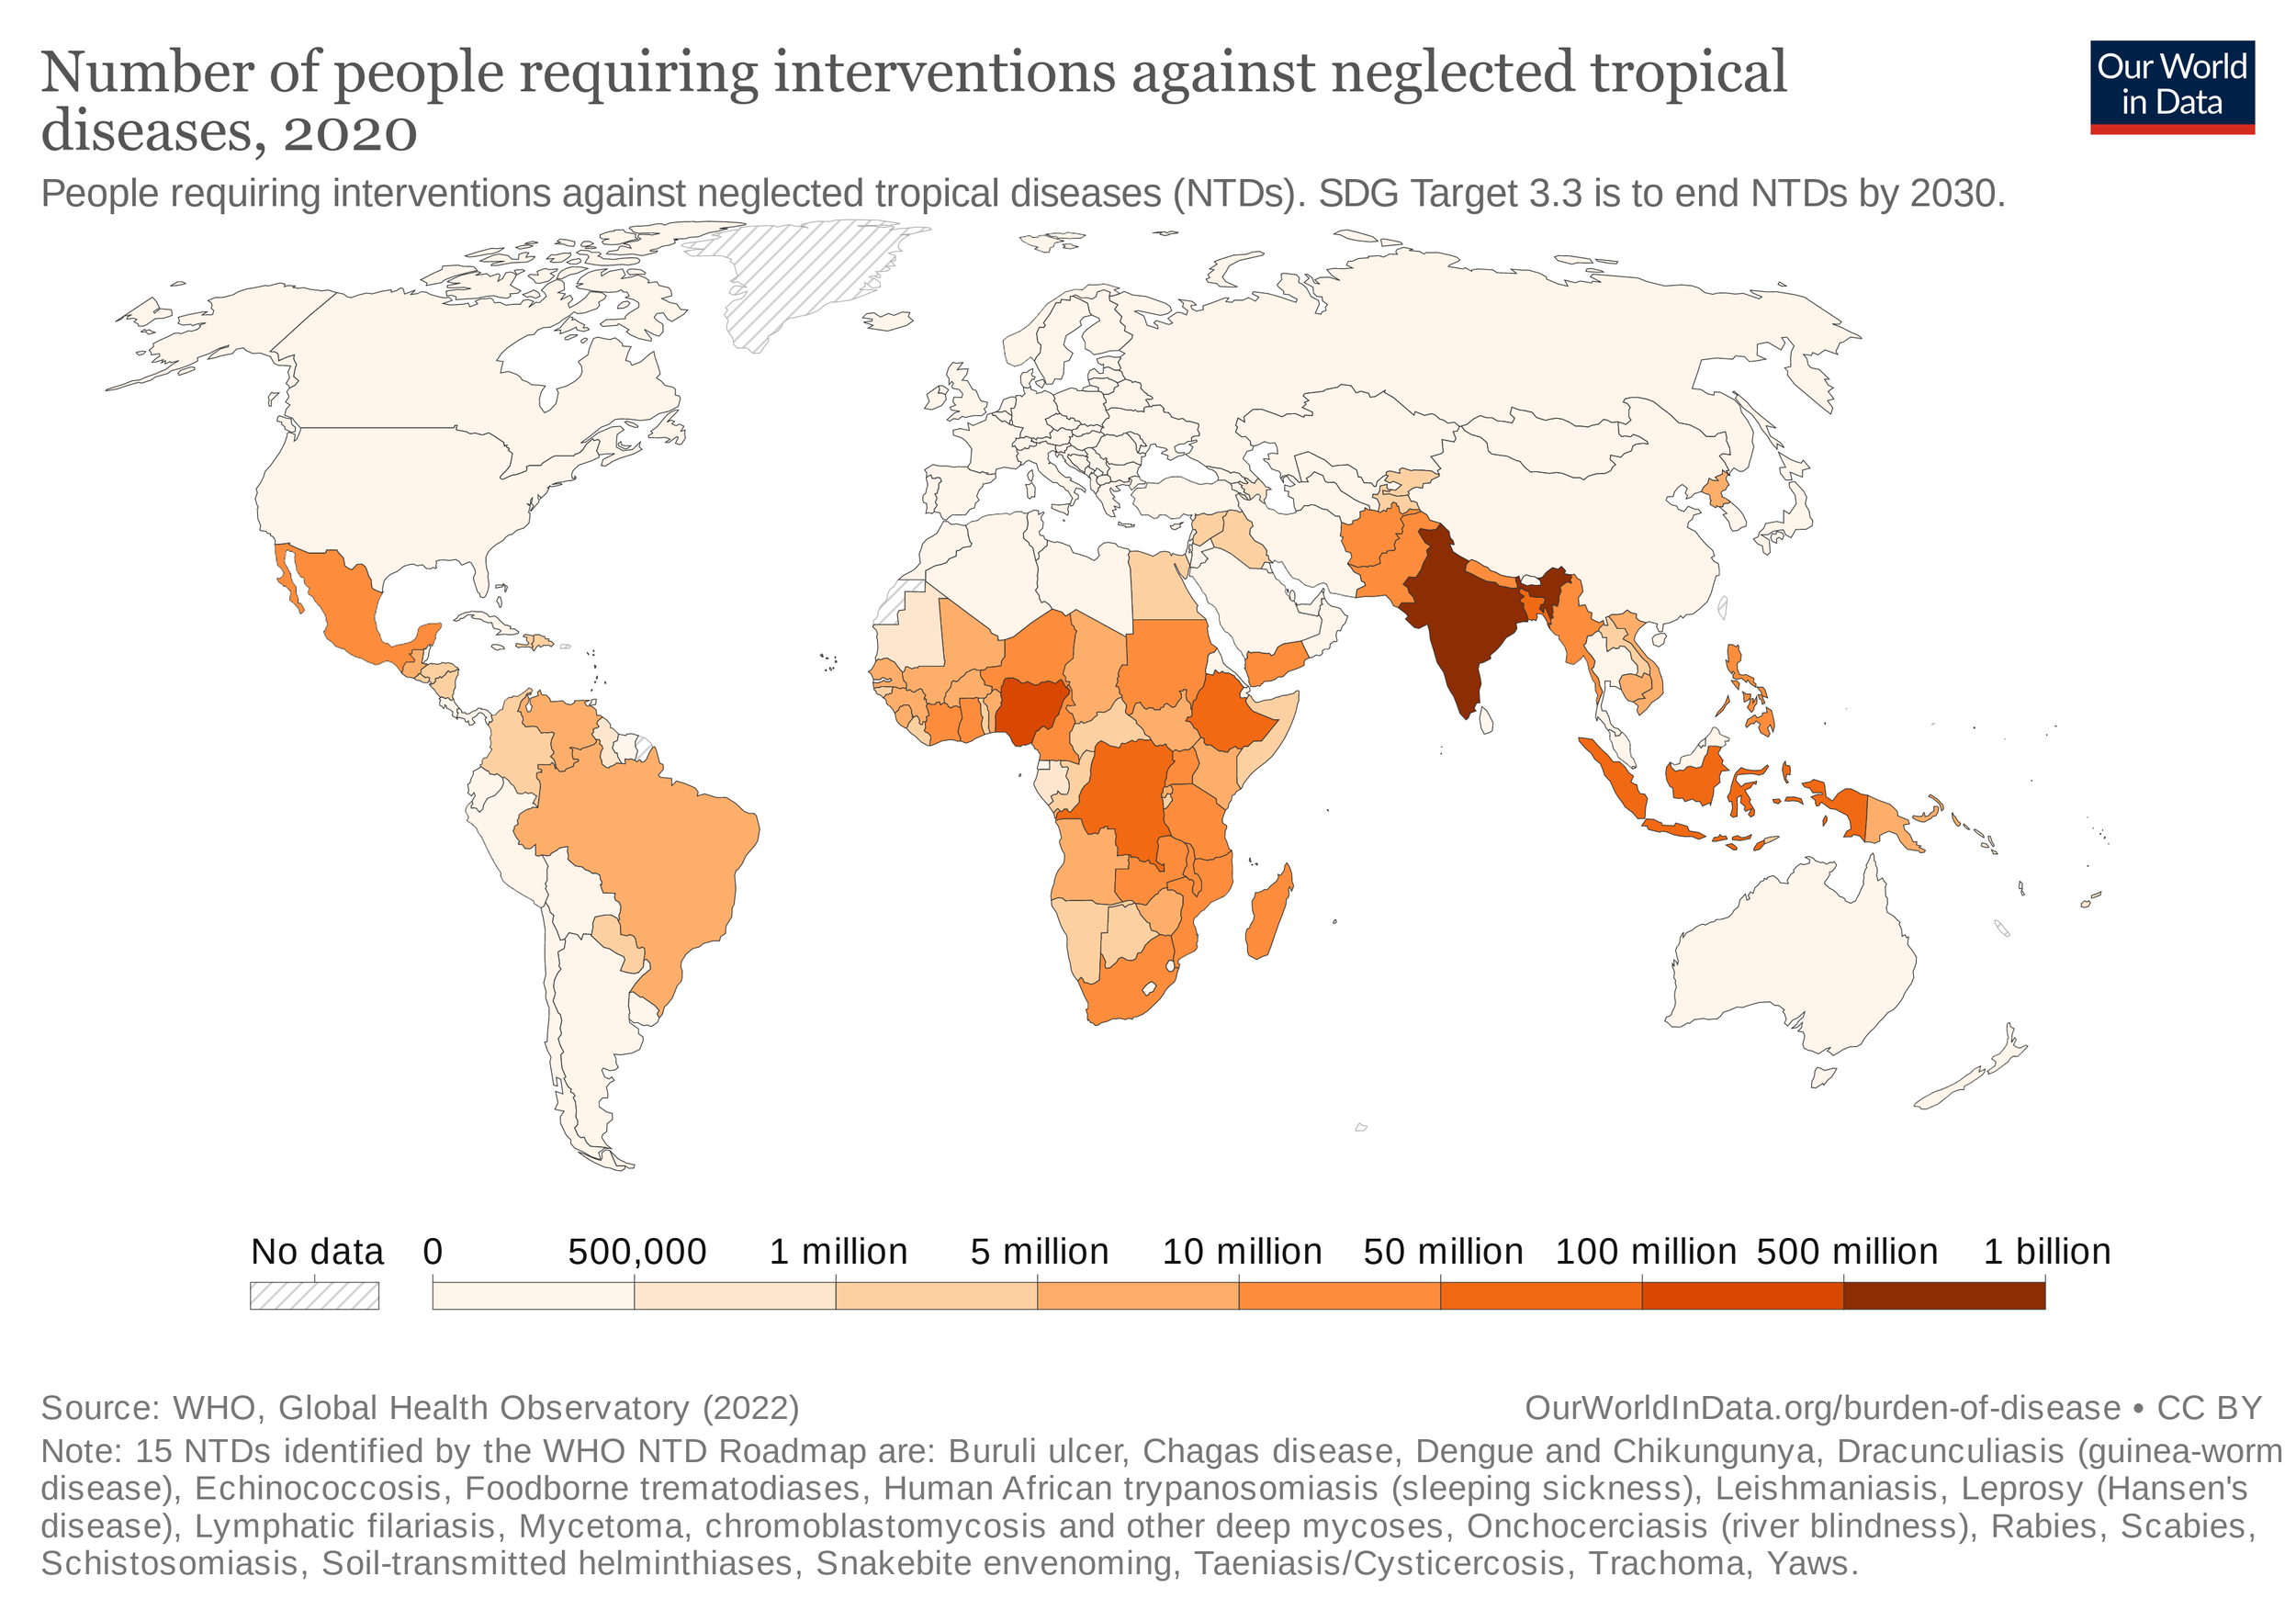
Progress made in lowering the number of people requiring interventions against neglected tropical disease has been slight over the span of the SDG period, down only 60 million since 2015 to its current total of 1.73 billion.

As with all SDG #3 targets, the provision of universal health care is a catch-all solution to almost all facets of achieving health and well-being for all, including ending the epidemics at the core of Target #3.3. 

SDG Target #3.2

SDG #3 is to “To ensure healthy lives and promote well-being for all at all ages.”

Within SDG #3 are 13 targets, of which we here focus on Target 3.2:

By 2030, end preventable deaths of newborns and children under 5 years of age, with all countries aiming to reduce neonatal mortality to at least as low as 12 per 1,000 live births and under-5 mortality to at least as low as 25 per 1,000 live births

Target 3.2 has two indicators:

  • Indicator 3.2.1: Under‑5 mortality rate

  • Indicator 3.2.2: Neonatal mortality rate

The under-5 mortality rate measures the number of child deaths occurring in a given population for those under the age of 5, whereas the neonatal mortality rate measures the number of infant deaths in a population.

Both indicators measure within a population for every 1000 live births, therefore excluding fetuses which did not survive the perinatal period. The definition of neonates, or newborns, for the purposes of Indicator 3.2.2 is within the first 28 days of birth, after which, the death of a child older than 28 days, but less than 5-year-old, would fit into the definition of Indicator 3.2.1

Data used for these measures is reported by UNICEF, the UN agency for aid for children. The source of data and estimates for child mortality and stillbirth estimates is collected by United Nations Inter-agency Group for Child Mortality Estimation (IGME), led by UNICEF, but supported by the WHO, the World Bank and the UN Population Division. The data is collected from a combination of deaths registered by the relevant civil bodies in a country, as well as census data and household surveys of full birth history. A full birth history is a list of all children a woman has given birth to, including their date of birth, sex, whether the child survived, the child’s age, if they’re still alive, or the age of death if they died. Another measure, summary birth history, only asks mothers for the number of children ever born and the number who died. Adjustments are made in calculating the mortality rate in areas with high prevalence of HIV/AIDS, as mothers who’ve died from AIDS are unable to report on the mortality of their children.

As of 2020, the child mortality rate for the world is 36.6 deaths per 1000 live births, down from 42.6 in 2015, the adoption year of the SDGs, and from 93.2 in 1990, yet still short of the 2030 target of 25 deaths of children under-5 per 1000 live births.

For the neonatal mortality rate, with an aim of 12 neonatal deaths per 1000 live births by 2030, the 2020 neonatal rate is 17, down from 19.3 in 2015, and 36.7 in 1990.

SDG Target #3.1

SDG #3 is to “To ensure healthy lives and promote well-being for all at all ages.”

Within SDG #3 are 13 targets, of which we here focus on Target 3.1:

By 2030, reduce the global maternal mortality ratio to less than 70 per 100,000 live births.

Target 3.1 has two indicators:

  • Indicator 3.1.1: Maternal mortality ratio

  • Indicator 3.1.2: Proportion of births attended by skilled health personnel

The causes of maternal death are manifold. Many of the deaths relate to complications of the cardiovascular system of the blood vessels and the heart. These include postpartum bleeding, which can be treated with intravenous blood transfusion in countries and communities where healthcare coverage is sufficient to offer this. 

Mothers can experience high blood pressure in their arteries as a result of the pregnancy, in some instances identified by proteinuria, an abundance of proteins found in the urine. High blood pressure accompanied by proteinuria may indicate a form of high blood pressure related to pregnancy known as pre-eclampsia.

Strokes are possible, whereby blood flow is unable to reach the brain in sufficient amounts, leading to the death of cells. Likewise, embolisms can form in the pulmonary artery, impeding the heart from sending blood toward the lungs.

Other reasons can include obstructed labour and unsafe abortions.

In countries with high prevalence of HIV/AIDS, this is the leading cause of death during pregnancy and postpartum. 

Relevant to this, those countries with low GDP per capita are more likely to have less healthcare coverage, making poverty an obvious risk factor for maternal mortality. Another risk factor related to this is the fertility rate, reflecting a phenomenon whereby the birth rates of poor countries are higher because of the poverty trap. When compounded by low health care coverage in these countries, a high fertility rate, low levels of income and low health care coverage form a recipe for high maternal mortality rates.

In terms of prevention of maternal deaths, complications in the term of a pregnancy, childbirth and the postpartum period can be mitigated by the presence of skilled birth attendants, in communities where doctors specialised in obstetrics and gynaecology are absent.

Other worthwhile preventions are family planning methods and birth control, to prevent unwanted pregnancies putting a potential mother at risk of death.

Prenatal care can also act as a form of preventive healthcare

Healthcare coverage also tends to ensure an aseptic medical environment, free of pathogenic bacteria, viruses, fungi and parasites which cause septic infections in tissues from these pathogens

Complementing the existence of health care coverage are public health campaigns, which can promote preventive behaviours and mitigate the risks of maternal death.

The Millenium Development Goals, the UN goals which preceded the SDGs, had an entire goal devoted to maternal health. Millenium Development Goal #5 set the objective to improve maternal health. Target #5A of the MDGs corresponds with the SDG target we’re looking at here, focused upon the maternal mortality ratio. Target #5A was to “Reduce by three-quarters, between 1990 and 2015, the maternal mortality ratio”

In setting a global standard for diagnosing health issues, the World Health Organisation classifies diseases according to the International Statistical Classification of Diseases and Related Health Problems (ICD). According to this classification, maternal death is defined as deaths occurring whilst a mother is pregnant, or within 42 days following the termination of the pregnancy. 

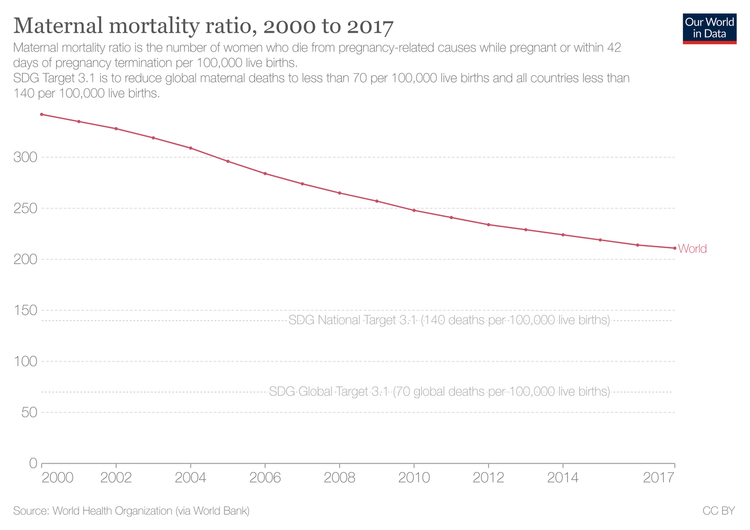
The most recent global data for maternal mortality ratio is from 2017, 211 maternal deaths per 100,000 live births, down only a little from the 2015 baseline of 219 per 100,000, and 342 per 100,000 from the start of the MDG period in 2000. To reach this target’s objective, we need to reduce this down to 70 maternal deaths per 100,000 live births by 2030. 

To offer an example of a country which is on has achieved this target, and is on track to achieve SDG #3 overall, Australia had a maternal mortality ratio in 2020 of 5.5 deaths per 100,000, or the equivalent of 16 maternal deaths.

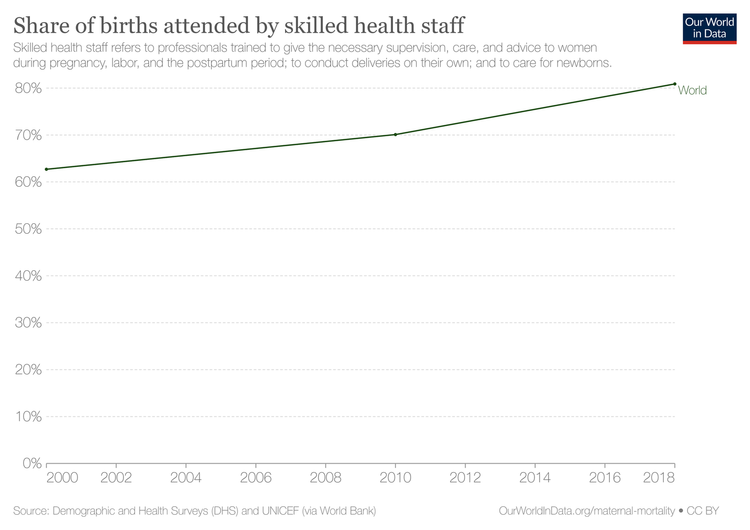
The proportion of births attended by skilled health attendants worldwide is 80% as of 2018, up from 62% in 2000.

SDG Target #2.C

SDG #2 is to “End hunger, achieve food security and improved nutrition and promote sustainable agriculture”

Within SDG #2 are eight targets, of which we here focus on Target 2.c:

Adopt measures to ensure the proper functioning of food commodity markets and their derivatives and facilitate timely access to market information, including on food reserves, in order to help limit extreme food price volatility.

Target 2.c has a singular indicator:

  • Indicator 2.c.1: indicator of food price anomalies.

An indicator of food price anomalies is a measure of market prices which deviate much higher-than-normal prices. One of the means to measure this is via a consumer price index, or CPI. A CPI is a statistic measuring the inflation experienced by households, or the price changes of household expenditure. Within this, different categories of household expenditure can be broken down from the total, such as food expenditure. 

At the international level, FAOSTAT, the statistical body of the UN’s Food and Agriculture Organisation (FAO) collects this data. 

This responsibility is a function of Article I of the FAO Constitution, which calls on the FAO to “collect, analyse, interpret and disseminate information relating to nutrition, food and agriculture.”

The FAO uses the FPMA, or Food Price Monitoring and Analysis, a tool which holds information and analyses of consumer prices of basic foodstuffs over the years across developing countries. Thanks to such tools and data, this evidence can be used to help make political decisions about food and agriculture at the national and international level.

SDG Target #2.B

SDG #2 is to “End hunger, achieve food security and improved nutrition and promote sustainable agriculture”

Within SDG #2 are eight targets, of which we here focus on Target 2.b, which is:

Correct and prevent trade restrictions and distortions in world agricultural markets, including through the parallel elimination of all forms of agricultural export subsidies and all export measures with equivalent effect, in accordance with the mandate of the Doha Development Round.

Target 2.b has a singular indicator: 

  • Indicator 2.b.1: agricultural export subsidies. 

First of all, what is the Doha Development Round? 

The Doha Development Round is a so-called round of negotiations within the World Trade Organisation, which began in 2001 at the WTO Ministerial Conference in Doha, the capital of Qatar, focused on the topic of lowering barriers to international trade. Whilst the WTO is an intergovernmental organisation, it is not part of the UN System

WTO Ministerial Conferences were subsequently held in Cancun and Hong Kong, but the contentions hindering agreement between developed and developing countries, particularly around agriculture subsidies paid by governments to agribusinesses, has been a relative constant, and is currently at an impasse.

Trade in goods and services between countries is generally considered a good thing. But when countries adopt protectionist economic policies such as taxes on imports or exports, import quotas, or any other hindrance at customs, other countries may consider such policies to put themselves at a relative trade disadvantage, in terms of the effect such policies could have on farmers and consumers in their own country.

Not all countries are members of the WTO, though 164 of the UN Member States are WTO Members. Largely, the organisation exists with the purpose of members collectively lowering tariffs and trade barriers, for both goods, as well as services and intellectual property, as well as setting out the procedures for settling disputes, whilst allowing for special treatment for developing countries. 

An important WTO treaty in the context of Target 2.b is the Agreement on Agriculture. This brings up another round of international trade negotiation, this one known as the Uruguay Round, under the aegis of the General Agreement on Tariffs & Trade, the forebear of the WTO.

The culmination of the Uruguay Round was the Marrakesh Agreement in Morocco, which established the WTO itself, as well as the Agreement on Agriculture was signed in April 1994.

It’s common for countries to support their domestic agriculture sectors, including subsidies for agricultural goods to be exported. In the jargon of Article 1 of the Agreement on Agriculture, this support is measured using the term the “Aggregate Measurement of Support”, for the annual monetary outlay in favour of an agricultural product. The idea is any support of income or price which boosts exports, or limits imports from another country, in a free trade environment, other countries are going to want to know why such support for the given product was necessary if they’re not to do likewise in their own countries. 

By definition of the WTO’s Subsidies Agreement, subsidies are any benefits conferred by government in the forms of transferring funds or guaranteeing loans, tax credits, providing goods or services outside of infrastructure, or otherwise purchasing goods, as well as financing a body outside of government to emulate the aforementioned functions. Per the Subsidies Agreement, WTO members are not to use subsidies causing adverse effects to other members, in the form of “injury to the domestic industry of another member”, or “causing serious prejudice to their interests of another Member”. Under Article 6 of the Subsidies Agreement, this is deemed as subsidisation greater than 5% of its value, debt forgiveness, and covering losses of an industry or a business, with the exception of once-off instances.

Measuring the target of eliminating agricultural export subsidies by 2030, using data from the WTO, the world has reduced this amount to the equivalent of $58 million as of 2019, down from $217 million at the adoption the SDGs in 2015, and a height of $6.69 billion in 1999.

SDG Target #2.A

SDG #2 is to “End hunger, achieve food security and improved nutrition and promote sustainable agriculture”

Within SDG #2 are eight targets, of which we’ll here focus on Target 2.a, which is:

Increase investment, including through enhanced international cooperation, in rural infrastructure, agricultural research and extension services, technology development and plant and livestock gene banks in order to enhance agricultural productive capacity in developing countries, in particular least developed countries

Within target 2.a are two indicators:

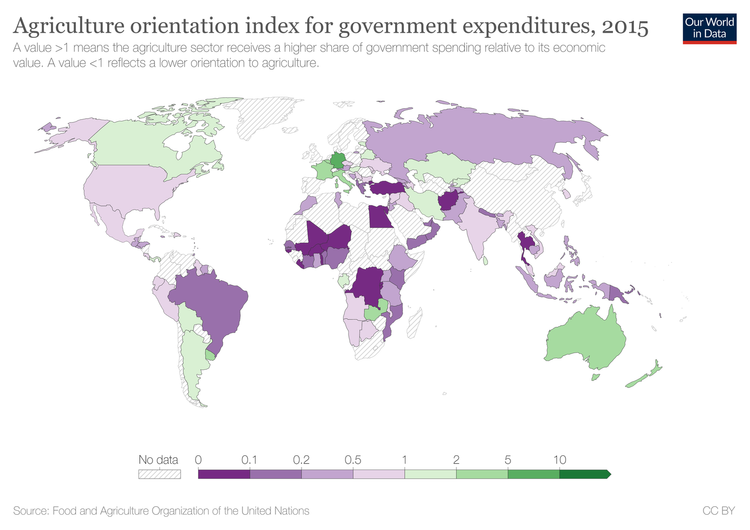
  • Indicator 2.a.1: The agriculture orientation index for government expenditures.

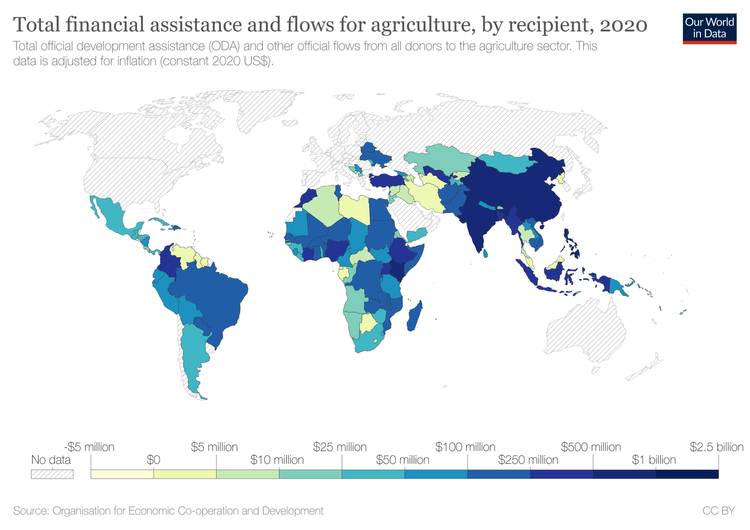
  • Indicator 2.a.2: Total official flows (official development assistance plus other official flows) to the agriculture sector.

Investment in general is central to the SDGs, with the implication monetary or other value is allocated with the incentive of a future return, suggesting the intergenerational aspect of the concept of sustainable development.

For the world’s most vulnerable, it’s a far stretch for most of our imaginations to suspend the ubiquity of money and finance in our daily lives to consider the lives of those tilling the soil for subsistence, far-flung from markets. For these people in such communities, the importance of their assets used for their livelihood, and the appreciation of such capital, can be life or death. Whilst in the developed world, talk of investment may bring to mind corporate profits dispensed as dividends to shareholders, for small-scale farmers, investment can mean a hand on the bottom rung of the development ladder out of penury.

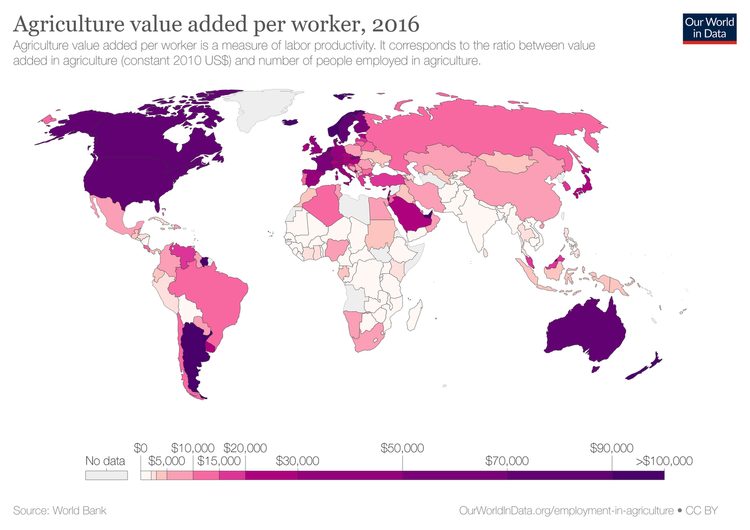
But government investment in agriculture needn’t necessarily be financial. It can come in the form of investments in physical capital, such as infrastructure. For a small-scale farmer in the developing world to participate in the economy, they must be connected with markets. If the farmer lives isolated from towns and cities to reach markets, they require roads and railways. To figure out if making the trip to market is worth the bother depending on prices they can fetch, they can save themselves travelling with access to telecommunications, and electric grids to power them. The importance of rural development also ties in with SDG #9 for Industry, Innovation and Infrastructure.

Aside from investing in physical capital, governments can invest in human capital, via education among other means. Amid the context of this goal, this means educating farmers, a practice known as agricultural extension. Cutting-edge techniques, skills and tools, and the fruit of science and knowledge can be imparted to farmers to better their yield and income, and more efficiently use inputs. The agricultural revolution was humanity’s first wave of technology after all, but in the modern era, its practice can still benefit from the internet and telecommunications to better participate in the global economy, and to better manage the environment.

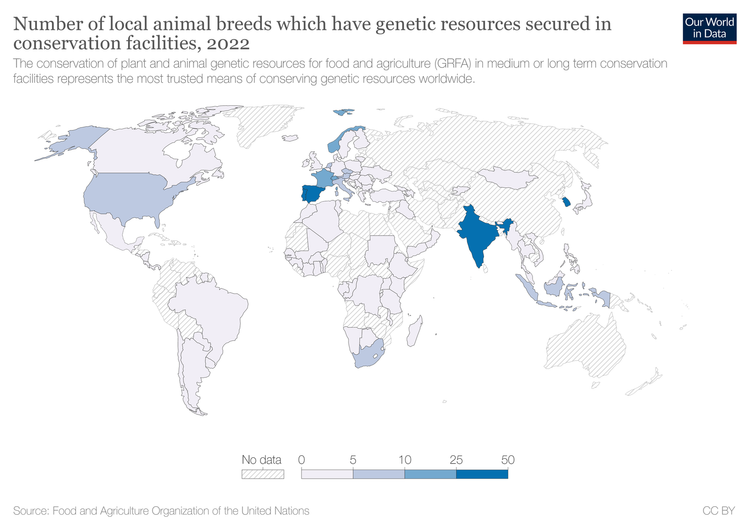
Also of importance are gene banks, where specimens of DNA are kept in repositories. A type of gene bank for plants are seed banks, where seeds are kept as a means of protecting genetic biodiversity in agriculture. For animals, sperm and egg cells of species are kept frozen.

For much of the developing world working in the agriculture sector, shocks from exchange rates from distant lands, fickle to the impact upon developing country food prices, can ruin lives and livelihoods. These reasons make the importance of governments acting as public investors for their own agriculture sector all the more important, as what financial profit can a private investor expect to make upon an agricultural sector in a given country which is barely productive? This would be too risky for the investor, for the smallholder would be too likely to default on any financing received.

Therefore, low-income governments need an investment strategy for agricultural development due to its centrality to rural development and poverty alleviation, and as we’ll see, statistics are central to its successful implementation.    

Looking closer at Indicator 2.a.1, the Agriculture Orientation Index (AOI) for Government Expenditures is defined as the portion of government spending toward agriculture, per the Classification of the Functions of Government, divided by agriculture’s contribution to the value-added share of a country’s GDP, according to the UN’s System of National Accounts. According to this definition, ‘agriculture’ includes the forestry, fishing and hunting sectors, per Section A of the UN’s International Standard Industrial Classification of All Economic Activities (ISIC), the classification of all economic activities. Also, according to this definition, government spending is considered to be all expenditure, as well as acquiring non-financial assets in support of the agricultural sector. The data to measure this indicator on government spending is collected by an annual questionnaire by the FAO, whilst the data on value-added agricultural output originates from national accounts.

Included in government spending on agriculture for the purposes of this indicator includes policies and programs on soil improvement and mitigating soil degradation, managing animal health, research on livestock and animal husbandry; research on marine and freshwater biology, and afforestation and forestry. This spending increases the agricultural sector’s productivity and income growth, as well as increasing capital, both human and physical. The public sector is able to fill this void, commonly receiving less investment than the private sector, with the markets failing to provide for income redistribution. 

For Indicator 2.a.2, we return to the topic of ODA, which we explored in the video for Target 1.a. The wording of Indicator 2.a.2 also mentions ‘other official flows’, which in the jargon of the OECD are official transactions not meeting the criteria of ODA, either because they’re not aimed at financing sustainable development, or are not concessional.

The OECD’s Development Assistance Committee identifies what specific sectors a transfer to a recipient is intended to foster, with transfers for this indicator targeted to the purposes of the agricultural sector. The OECD maintains all this information in its Creditor Reporting System, to compare where aid from DAC member countries has gone, the purpose the donor intended to serve, and which policies were used to implement such intentions.

SDG Target #2.5

SDG #2 is to “End hunger, achieve food security and improved nutrition and promote sustainable agriculture”

Within SDG #2 are eight targets, of which we’ll here focus on Target 2.5: 

By 2020, maintain the genetic diversity of seeds, cultivated plants and farmed and domesticated animals and their related wild species, including through soundly managed and diversified seed and plant banks at the national, regional and international levels, and promote access to and fair and equitable sharing of benefits arising from the utilization of genetic resources and associated traditional knowledge, as internationally agreed.

Within target 2.5 are two indicators:

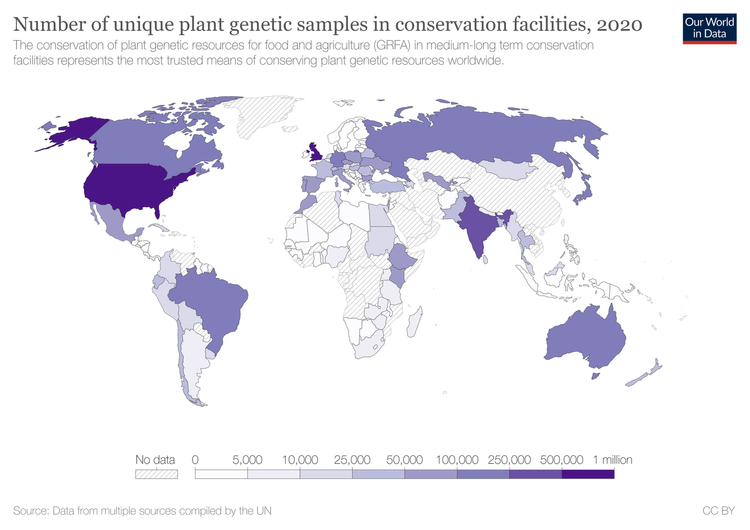
  • Indicator 2.5.1: Number of (a) plant and (b) animal genetic resources for food and agriculture secured in either medium- or long-term conservation facilities.

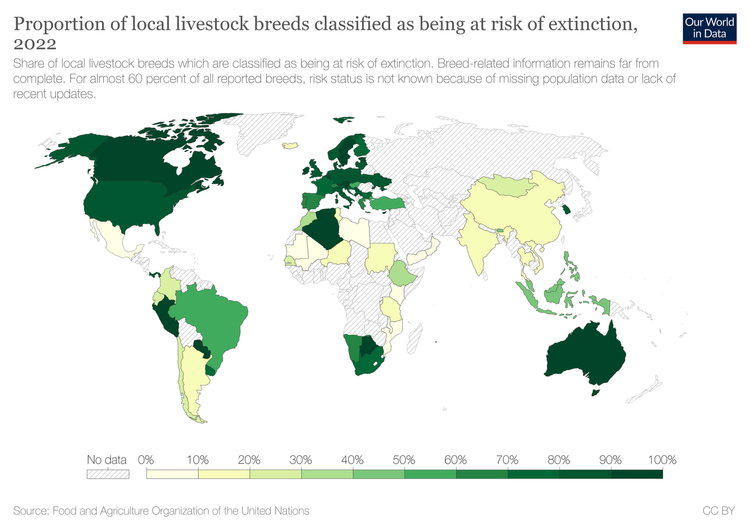
  • Indicator 2.5.2: Proportion of local breeds classified as being at risk of extinction.

The UN agency overseeing the topic of genetic resources for food and agriculture is the Food and Agriculture Organization’s Commission on Genetic Resources for Food and Agriculture

Much of this conservation occurs in gene banks, which are biological repositories of the DNA and RNA of life forms, which exist to maintain the diversity of genes of various lifeforms. One of the reasons for this is because biodiversity - explored in greater depth in Goals #14 and 15 - is necessary for food security, in line with the aims of Goal #2 to end hunger and ensure sustainable agriculture.

Genebanks maintain such samples outside their natural environment (or ex situ) rather than protected or managed on the farm (in situ). The FAO maintains two systems to help account for the genes maintained by gene banks, each system pertaining to the respective use of animals and plants for food and agriculture: the Domestic Animal Diversity Information System (DAD-IS) and the WIEWS (World Information and Early Warning System on Plant Genetic Resources for Food and Agriculture).

The management of plant genetic resources for food and agriculture is guided by International Treaty on Plant Genetic Resources for Food and Agriculture, a global treaty aiming to ensure food security, nature conservation, and the sustainability of plant genetic resources. This treaty is implemented via the Second Global Plan of Action for Plant Genetic Resources for Food and Agriculture, adopted by the FAO in 2011.

The corresponding agreement for animal genetic resources for food and agriculture is the Global Plan of Action for Animal Genetic Resources, adopted by the FAO Commission on Genetic Resources for Food and Agriculture in 2007, as well as the Convention on Biological Diversity.

SDG Target #2.4

SDG #2 is to “End hunger, achieve food security and improved nutrition and promote sustainable agriculture”

Within SDG #2 are eight targets, of which we here focus on Target 2.4, which is:

By 2030, ensure sustainable food production systems and implement resilient agricultural practices that increase productivity and production, that help maintain ecosystems, that strengthen capacity for adaptation to climate change, extreme weather, drought, flooding and other disasters and that progressively improve land and soil quality.”

Within target 2.4 is a sole indicator:

  • Proportion of agricultural area under productive and sustainable agriculture.

We touched on the importance of the future of sustainable agriculture in an earlier SDG #2 target. It’s a complex issue, and very much sensitive to the varied unique agro-ecologies the world over.

Sustainable agriculture seeks to meet the challenges of scarce freshwater resources, erosion, surface runoff, salinisation, imbalances in the environmental cycles of nitrogen, phosphate and carbon, slash-and-burn practices clearing forests, using advanced techniques of irrigation and water efficiency, crop rotation.

Whilst not at scale, the practices of urban agriculture emphasise local food like roof gardens, community gardens, sharing gardens. Other concepts of importance include organic farming using natural manures and other techniques in contrast to synthetic fertilisers. Regenerative agriculture is another field receiving more attention recently for its emphasis on protecting biodiversity and ecosystems, a philosophy shared with the discipline of permaculture. 

Standards and certification have also made recognising food grown sustainably easier for consumers, such as organic certification, the Rainforest Alliance and Fairtrade certification.

At a political level, the European Commission’s European Green Deal sets forth to make European food systems sustainable, whilst the US Department of Agriculture has historically been a driver of intensified agriculture, with attendant ills for human diet and ecological damage.

Sustainable food systems don’t just encompass how food is produced, but its distribution, with local food being environmentally better, as well as benefitting the sustainability of our diets and food loss and waste

In acknowledging the importance of agriculture’s relationship with ecosystems, climate change, extreme weather, drought, flooding and other disasters, we see SDG #2’s interplay with Goal’s 13 through 15 - all topics we’ll examine further in the targets within those respective goals.

Without agriculture our civilisation never could have reached the levels of population size nor prosperity many of us experience. Advances in agronomy have proffered more food, fuel and fibre for humankind. Examples are agrochemicals, pesticides to keep pests away from crops, fertilisers to provide plants the chemical nutrients they need to grow.

Yet agricultural practices do not come without an environmental impact. The welfare of animals beside humans is largely neglected or ignored. Agriculture has been, and continues to be a major drive of climate change, the practice itself in its current form a large greenhouse gas emitter. 

The importance of forests to heading off climate change is widely understood, yet deforestation still occurs on a massive scale for the purposes of creating pasture for grazing.

Can our aquifers, which sustain our vital freshwater supplies contend with what agriculture draws from it, and pollutes it with? Will the degradation imposed on the land put us at greater risk of desertification, turning once healthy soil mixtures, supporting life itself, into drylands. 

Can the environment handle what we take from it and feed into it, or are we risking the depletion of resources necessary for human survival? Are we risking the compromise of the quality of our air, water and soil - even entire ecosystems? Do our patterns put at peril the destruction of habitats, the extinction of species of wildlife, biodiversity loss and pollution at large? Is the production of animal feed for livestock an inefficient use of precious resources?

Have we placed ourselves higher on the food chain than is necessary to live healthy lives? Do we need to slaughter cattle, pigs and sheep? Do we need products from the milk of cows, buffaloes, goats and sheep? Do we need textiles derived from sheep, cashmere and mohair from goats and animal skins for clothing? 

Both humans and animals are affected by the use of antibiotics, growth hormones and genetically engineered lifeforms in the meat and dairy industry.

We humans need fuel to work; raw materials to turn goods into products; grains, vegetables and oils for cooking.

Yet our policies around agriculture need to change, and we need to harness the science and economics of agriculture to be sustainable.

SDG Target #2.3

SDG #2 is to “End hunger, achieve food security and improved nutrition and promote sustainable agriculture”

Within SDG #2 are eight targets, of which this episode will focus on Target 2.3:

By 2030, double the agricultural productivity and incomes of small-scale food producers, in particular women, indigenous peoples, family farmers, pastoralists and fishers, including through secure and equal access to land, other productive resources and inputs, knowledge, financial services, markets and opportunities for value addition and non-farm employment.

Within target 2.3 are two indicators:

  • Indicator 2.3.1: The volume of production per labour unit by classes of farming/pastoral/forestry enterprise size.

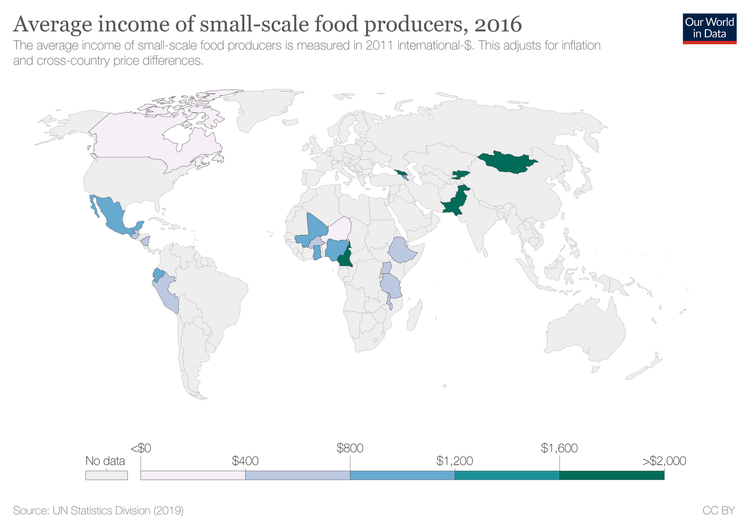
  • Indicator 2.3.2: Average income of small-scale food producers, by sex and indigenous status.

Target 2.3 is the first target focusing on agriculture, an aspect of sustainable development perhaps undervalued for its impact on all facets of human life.

The cultivation of crops and rearing of livestock was not always inherent to human culture. It sprung forth when humans shifted from hunter-gatherer lifestyles, settling into the land in fixed civilisations, tilling the land to make it arable to sow seeds, and domesticating animals around them on farms, eventually producing crop harvests to a surplus level beyond mere subsistence. 

In the modern era, agriculture has shifted from smallholding to industrialised farms, characterised by crop monocultures and animals selectively bred through science for the optimal traits, farming crops and animals intensively. The practice of animal husbandry of livestock produces commodities such as meat, milk, eggs and animal fibres like fur, leather and wool for human use.

So, while target 2.3 is asking us to double agricultural productivity and crop yield for the purposes of food security, we must do so sustainably, both in terms of the environment, but also economic inequality, mindful of the effects of the market value on the factors of production and outputs affecting those at the bottom distribution of wealth and income in society. Making this balancing act trickier is the trend of human overpopulation at unsustainable levels, predominantly in countries facing the most acute food security challenges.

In parallel, target 2.3 is asking the world to double the money received in exchange for the agricultural goods of farmers in each given country operating in the bottom 40% of land size in hectares, number of livestock, and revenue from agriculture.

In particular, it singles out women, indigenous people whose farms may have been historically compromised by settler colonialism, family farms, nomadic pastoralists tending herds of sheep or cattle and fishermen.

Quantifying this, within Indicator 2.3.1, is the volume of agricultural output of crops, livestock, fisheries and forestry per day of labour, measured in dollars. 

The means of measurement are the FAO’s AGRISurvey, or the World Bank’s Integrated Surveys of Agriculture, a household survey financed by the Bill & Melinda Gates Foundation, as part of the broader Living Standards Measurement Study.

Another of the UN’s specialised agencies working toward the ends of this indicator is the International Fund for Agricultural Development, tasked with the financing of poverty and hunger in the rural areas of developing countries. The IFAD, in tandem with the FAO and World Bank have developed a system called RuLIS, or the Rural Livelihoods Information System to harmonise the household surveys on rural poverty. 

The importance of this data is consistent with Article I of the FAO, outlining the organization’s functions, i.e. “Collect, analyse, interpret and disseminate information relating to nutrition, food and agriculture.”

Indicator 2.3.2 looks at a similar measure of smallholder agriculture incomes.

As is to be expected, small-scale farmers have produced lower output per day of labour in the SDG period than their larger counterparts, with larger producers earning two or three times the income of small-scale producers.

In addressing the disaggregation by sex of Indicator 2.3.2, male-led households have been achieving higher productivity and larger incomes than female-led households.

SDG Episode #6 - Guillaume Lafortune, SDSN

In this episode, we’re joined by Guillaume Lafortune, Vice President and director of the Paris office of the SDSN, the Sustainable Development Solutions Network, under the auspices of the UN. Guillaume also coordinates, and is a co-author, of the SDSN’s Sustainable Development Report, published each year since 2016

Dominic Billings: Guillaume, what was your path to your current career? I know that you studied Economics and Public Administration in Quebec. But what was your path to where you are now?

Guillaume Lafortune:  Well as you said, Dominic, I’m an economist by training. I've always been also interested in public policies. I would say, at large. Did a very classic path from a school of public administration to entering government, the Ministry of Economic Development, in Quebec, Canada, working with small and medium enterprises, and trying to see how we can support them in scaling up, and including looking at international opportunities also abroad, Quebec being a small market. There's always this idea that it's important also for Quebec companies to be in touch with what's going on elsewhere in the world. So, both this sort of focus on economics, but also the international dimension, has always been sort of part of my background, and broad interest in public policies. 

And then I think the other thread would be I’ve always been interested in doing research. But doing research that you can actually present to those that are eventually taking the decisions. That's why, for me, it was very good to enter, after my experience in government, to join the Organization for Economic Cooperation and Development (OECD) in Paris, where you do a lot of statistical analysis studies. But then you do present to the people in their governments, who are in charge of the respective portfolio? Whether it is about governance reform - I've worked quite a bit in the Public Governance department - but also, people in charge of the environmental portfolio in their country, education, health, and so on. You do present your studies to those that make decisions. 

And finally, that's also the link with my current work at the Sustainable Development Solutions Network, since we are a network of scientists that try to establish this sort of link with policymakers, with the UN system. We've been the knowledge brokers between what science is saying we should do, some of the solutions that science can bring, and also what the UN System and national governments can do. So, this focus on science on one side, but also the direct connection with decision-making, has always been an important part, I would say, in my career.

Dominic Billings:  You're one of the co-authors of the SDG Index - now titled the Sustainable Development Report. What was the story behind the formative stages of that? I know you collaborated with Guido Schmidt-Traub in particular, and Christian Kroll, one of the progenitors of the original. What was that process like in the very beginning for you?

Guillaume Lafortune:  So, in a nutshell, what the SDG Index does is, every year we track the performance of all the UN Member states on the 17 Sustainable Development Goals. These are the goals that have been adopted by the international community, actually by all UN member states, back in 2015. We have to remember that this is the only comprehensive vision adopted internationally that looks at both social and economic progress, but also environment, climate, biodiversity and governance issues. So, it's a very comprehensive framework. There are 17 goals, 169 targets, and what we do at the SDSN, working of course with partners, is to look every year how countries are performing on those 17 SDGs. So, in terms of major stages, at the very beginning when we started doing this, there were really a lot of technical questions that needed to be resolved. Which indicators do you select? How do you aggregate across goals? How do you create an overall ranking, scoring and so on. So, we did quite a bit of work, both internally, but also in making sure that we were getting the necessary external checks to ensure that was scientifically robust 

So, we were peer reviewed by Nature Geoscience, Cambridge University Press, but also, we got in touch with the European Commission, and said, “Could you do a statistical audit of that report, because we really want to make sure that we're doing this right?” And also, that effort of comparing our results, via-a-vis other assessments that are being done by other organizations to really understand why, for certain Goals, our assessment was slightly different than what the OECD is presenting, or what Eurostat is presenting, for instance. So, the first step was really to make sure we were doing it right, and now the methodology is stable - we've been doing this since 2016-2017, so it's been a couple of additions now - it's really about how do we connect the findings with policy messages and the broader discussions around “How do we finance this agenda?”. One illustration of that second phase is we move from the report, which was called the ‘SDG Index’, to a report which is now called the ‘Sustainable Development Report’, because there is more than SDG Index. The Index remains the backbone, but there's much more policy discussions and sections.

Dominic Billings: How do you feel about the progress of the SDGs? The data and the report speak for itself, but on a personal level, how do you feel?

Guillaume Lafortune: Well, first of all, I continue to think that it is an incredible idea. This idea that we establish goals for humanity as a whole, that called for eradicating extreme poverty; hunger; access to social protection; healthcare and education for all; fight against income and wealth inequalities; access to water and sanitation, and then also move towards responsible consumption and production; climate action, and then strengthening institutions and international partnerships. I continue to think that this is an incredible idea, and it's the first time in human history that we were able to agree on a common set of goals. 

Despite differences in cultures, history and approaches to economic and public policy, all governments around the world managed to say “These are goals we should all be pursuing”. I really hope that this idea of goal-based development can continue. Obviously, now we should maintain our effort to try to do major breakthroughs on this Agenda until 2030. But then beyond 2030, I think it will be very important to also have an agenda that continues this sort of goal-based development. 

In terms of how the world is doing on the Sustainable Development Goals, it's very clear that the multiple crises we've been facing - from COVID-19, geopolitical tensions, security crises, now inflation, probably recession in many parts of the world, which is to come, budget pressures - these led to major setbacks and reversal in SDG progress. So, we were seeing overall, from the moment the SDGs were adopted to 2019, the world was making progress year-on-year. The overall SDG Index was progressing year-on-year until 2019, which was notably led by progress in some of the countries and regions in the world that were starting from very low points on the SDGs. So major progress in terms of fighting extreme poverty, for instance. But also access to basic infrastructure and services as well. Even before COVID-19 hit, we were still saying progress was too slow, certain Goals were not moving in the right direction, and there were major disparities across countries. But on average, the world was progressing on this Agenda. Since 2020, worldwide, we do not see any more progress on this agenda. 

It's stagnated and even reversed in progress in many parts of the world. What's a little bit sad is that reversal in progress is happening in particular in countries that are poor and vulnerable, and did not have the ability, for instance during COVID-19, to mobilize large amounts of money to finance the urgent expenditure related to the pandemic - but also, those recovery plans, as we have been able to do in a lot of the high-income countries. That's why all those international summits have happened -we're right after COP 27, there was an important G20 meeting also a few days ago - but also, we're heading towards a Heads of State Summit on the SDGs in September 2023

These are all very important to recognise where we've made progress since 2015 - because we're at halftime now in this agenda. But also come up with solutions and renewed commitments on how we are going to restore and accelerate SDG progress over the next couple years?

Dominic Billings:  You mentioned what was the ‘SDG Index’ is now been expanded to the ‘Sustainable Development Report’, and one of the features of the most recent report was financing, and another was spillover effects, of which the SDSN, with you as co-author, have published many reports, including as recent as this week

What about spillover effects requires the focus you’ve given it?

Guillaume Lafortune: The basic idea behind the spillover effects is, if we consider the SDGs as a global responsibility, and if countries aim to decarbonise their energy system and move towards more responsible consumption and production, the decarbonisation effort should not be achieved by outsourcing high-emitting sectors - whether it's cement or steel - to another country, and then re-importing production, so the emissions happen outside of our borders. 

So, on paper, everything looks good. We're” moving forward” in terms of decarbonising our economy, but in terms of overall carbon emissions, these are being outsourced and they happen elsewhere. The idea behind spillover effects - to capture those impacts embodied into trade and consumption. There are other types of spillover effects - for instance, financial flows and financial spillovers e.g., tax evasion, profit shifting, unfair tax competition, that can undermine the ability of other countries to mobilize resources to, to move towards those Goals.

And so, as you said, Dominic, at the SDSN, we've always considered integrating those spillover effects. Again, considering the SDGs are a global responsibility, and it makes no difference for climate change whether greenhouse gas emissions are generated within a country’s borders, or in another country for satisfying production. 

And by the way, that explains also why our results can sometimes be different from other assessments, because we include those types of indicators. On the spillover aspect, it's not only about environmental spillovers, but increasingly we also document deforestation embodied in our consumption. We also look at how much consumption, especially in rich countries, is leading to resource depletion, including water scarcity, in the rest of the world - but also social impacts. So, we're able to track now that each year, through the consumption of textile products, there's about 400 people that die in the world to satisfy the European Union's consumption of textile, and more than 20,000 people that have non-fatal accidents at work. We released a study earlier this week where we've identified that each year European consumption is associated with 1.2 million cases of forced labor around the world.

And we did a deep dive into fossil fuels and mineral materials, which is one of the supply chains where those impacts happen. So, the point here is to say, we need to track the effect we have through consumption, and we also need to adopt policies to curb those spillover effects and work with partner countries so we reduce our global footprint from consumption.

Dominic Billings: You mentioned the recent UNFCCC COP in Sharm El Sheik, but I know you’re going to the Convention on Biological Diversity in Montreal. The Paris Agreement and the UNFCCC is enmeshed as part of SDG 13, but the ethos of the Convention on Biological Diversity underpins SDG 14 and 15. How do you feel about the outcome of COP 27 in Sharm El Sheikh, and how do you feel about the forthcoming CBD COP in Montreal?

Guillaume Lafortune:  On the COP in Egypt, the outcome is mixed. On the positive side, there's been quite a good breakthrough when it comes to recognizing some of the historical responsibilities, in terms of emissions for climate change, and the fact we need to move into a financial mechanism to share more fairly globally, the costs of losses and damages related to natural and climate events. But also, the costs of adapting infrastructure especially, so the most vulnerable countries that are often not responsible for climate change, can finance losses and damages and adaptation. So, at least the political consensus that emerged this year is a move in the right direction. The major aspect where we're not seeing enough progress is commitments, pledges and trajectories on the mitigation side, in terms of accelerating the decarbonization of the production system and economies globally.

So that remains an important loophole, and it's becoming, you know, harder and harder to stick to that 1.5-degree objective, as part of the Paris Climate Agreement. But on the biodiversity side, it's also really important. On the climate side, we have the Paris Climate Agreement - a global target has helped to mobilize actions, energy and momentum around that goal. 

The fact that we don't have the equivalent of a Paris Climate Agreement for biodiversity might explain why we're still a little bit lagging behind when it comes to global actions on biodiversity. The numbers are terrible when it comes to biodiversity loss, deforestation, and so on. To give a very practical example, when we look at the bees, 70% of what we eat requires pollination. So, as we see the number of bees dropping, there's a real question around, “What are we gonna do?” This is where I'm not sure innovation and progress - for instance, replacing bees with drones - will really help us out. It's really an issue around how do we prevent this from happening, and how do we also put a price on the natural services that nature is providing?

So, there's big discussions right now around pricing the natural services. But beyond that, I really hope Montreal can become for biodiversity what Paris has been for climate.

So big hopes for the biodiversity conference in Montreal, and it's very important, because we see it every year when you do the SDG Index. The biodiversity indicators are really not moving in the right direction at all.

Dominic Billings: Guillaume, on a personal level, if you trace your life from maybe the beginning of your tertiary education through to now, what's driven you? What's brought you to where you are now a person?

Guillaume Lafortune: I've always wanted to try to work for the common good. At least do my best to do something that has a positive impact on the world. Now I have two kids - they're very young, a small baby and a four-year-old - but in 10 or 15 years, when I’ll be explaining to them what I'm doing professionally, I'll be able to demonstrate or show them I've done my best. 

So, they can live in a world where you have opportunities, you are safe. You're not being hit by droughts and heat waves and natural disasters all the time. We live in a world where there's partnerships, where the multilateral system is able to address some of the challenges of our time. So, all of those things, in my view, can help, and address those big challenges. My hope is to have a positive impact by making that connection between what science and data evidence tells us.

This is important, in this post-truth era, and fake news and so on, to try to have groups of people and networks of scientists, that can try to bring the evidence to the policymakers, and then see how we can move forward on those Sustainable Development Goals.

Dominic Billings: Thank you so much, Guillaume, for your time - so appreciative. I feel like both yourself and the co-authors of the Sustainable Development Report in particular have done as much for sustainable development, and the SDGs, then anyone. 

Guillaume Lafortune:  Thank you very much, Dominic. 

SDG Episode #5 - Mick Hase - SEVENTEENx

In this episode, we’re joined by Mick Hase, founder of SEVENTEENx.
SEVENTEENx are speaking events championing the SDGs to educate, engage and enable the business community to change the way of business, drawing on Mick’s own expertise as a business coach and management consultant, as well as an entrepreneur himself.

Inspiring change-makers from each city SEVENTEENx holds events has the opportunity, for 17 minutes each, to tell their story of impact and social outcomes relating to one of the SDGs, along with a Q&A panel of all speakers.

On November 10, the first SEVENTEENx event since the start of 2020 will be held, both live in Brisbane at QUT Business School, as well as online. Tickets can be found at the SEVENTEENx website.

Additionally, Mick Hase has his own podcast, titled ‘SEVENTEENx’, which you listen and subscribe to on Spotify and most podcast platforms.